What's new

List of countries by government debt

That just shows an unequal distribution of wealth. Moscow on the other hand has an average high income lifestyle. While Mumbai has a slum right next to ambani house.

We should be in our own race to reduce poverty, unemployment and illiteracy. We should be fighting together to eliminate these things in our countries, not spread more hatred. Healthy competition is good for us.

You should be counting GDP PER CAPITA.

Overpopulated countries like India will always rank at the top.

Compare with China, who has a similar population as yours, and look at the piss-poor gau mutra showing.

And Comparing London, Shanghai, Beijing and HongKong with Mumbai is like comparing your kaamwali bai to Aishwarya Rai.

Not even in the same league as infra, city services, convenience to access parts of the city and a hundred other things.

I know it looks good in Swarajya Mag, but come the f*ck on !!

Stay limited within India.

Don't make me post pictures of Dharavi slums - which should be enough.

No, that's not what PPP means.
It means that the purchasing parity within the country is a lot higher.
This is due to the low cost of Labour and low living standards in India, which means that a lot more can be purchased for the same amount, theoretically making the average person better off on paper, but not when you have a colossal population like India.

You've again proven that India suffers from a colossal amount of poverty due to the massive value of its PPP economy within the nation and that a lot more can be bought for a lot less due to the higher value of currency to the average person.

Of course this is going to be lower in the UK where the currency value for the average person is lower due to the higher prices of commodities and services due to having a much more advanced educational and operational system, which leads to much higher competition in demand and therefore better living standards in the long run


here we have news as below, India is among nations who give 'free Ration/food' to 2/3rd population, if they exercise their rights in India :coffee:

what about other South Asian nations? do they offer the same for their poor? how many countries in world where poor don't sleep hungry? it cost India budget around $30bil per year :-)
.
=>

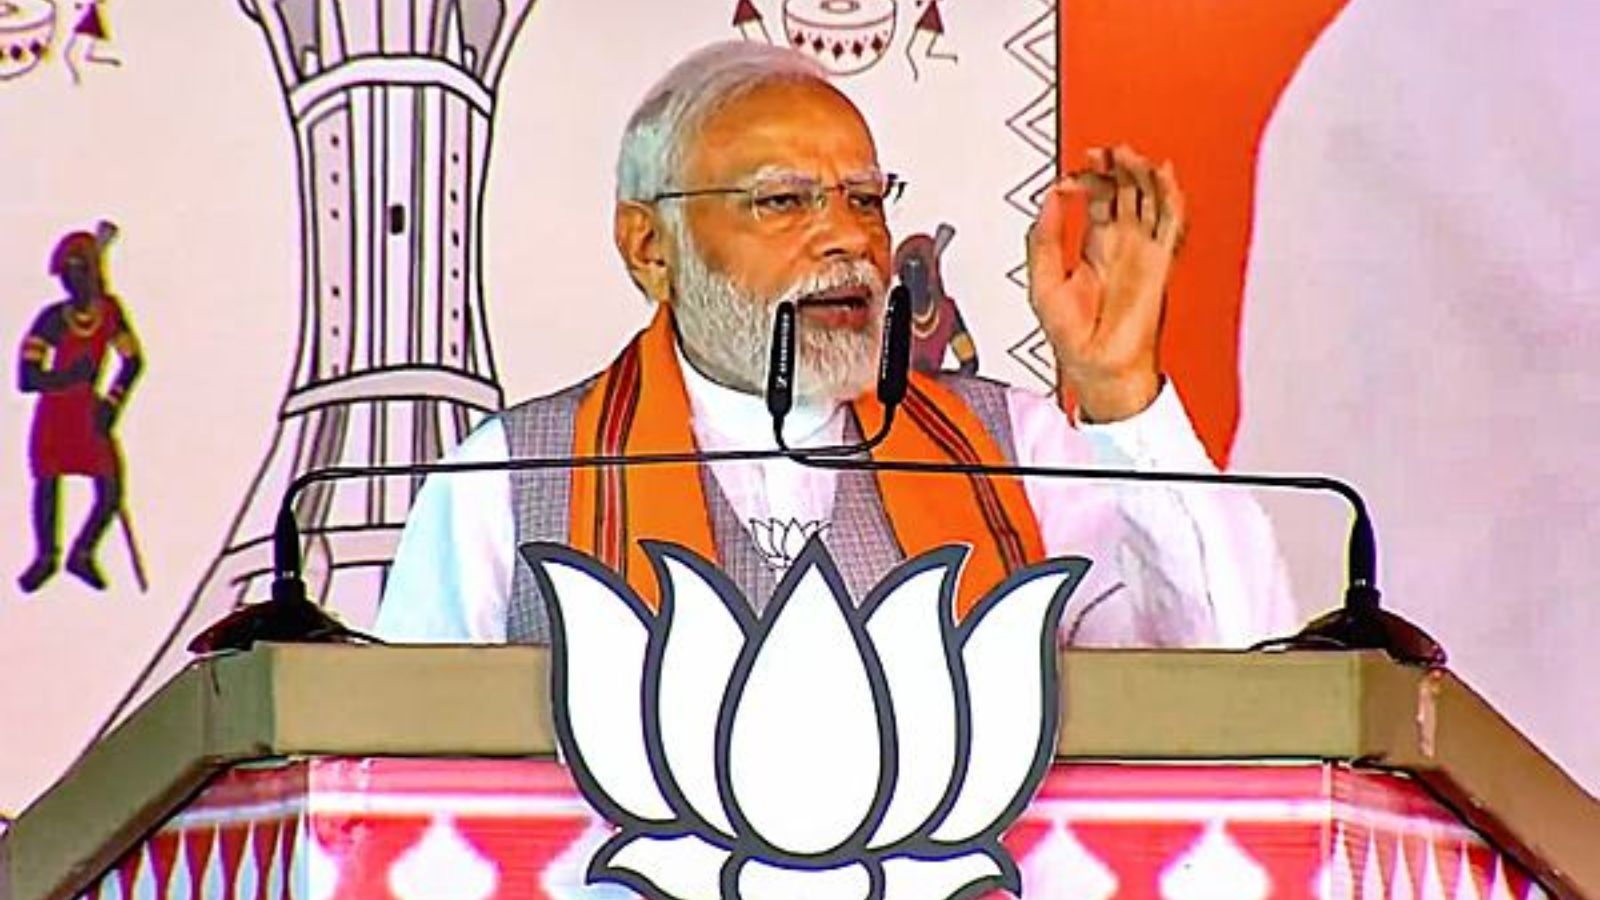
Free ration to the poor will be extended for 5 years, 80 crore will benefit: Modi​

"During Covid-19, the biggest concern of the poor was what they would feed their children... Then I decided that I will not let any poor sleep hungry, hence the BJP government started the Pradhan Mantri Garib Kalyan Anna Yojana," PM Modi said.

.

=> https://www.businesstoday.in/latest...for-next-five-years-pm-modi-404558-2023-11-04


BJP-led Centre to extend free ration scheme for 80 crore poor for next five years. PM Narendra Modi made the announcement at a rally in Chhattisgarh. According to government officials, this move will incur an expenditure of approximately Rs 2 lakh crore.
 
.

Why does ⅔ of the population rely on state rations?

my family dont. people of my colony also looks the same in Lucknow :-)

but in tough time, this is the option available for we all in India :enjoy:
.

We should be in our own race to reduce poverty, unemployment and illiteracy. We should be fighting together to eliminate these things in our countries, not spread more hatred. Healthy competition is good for us.

hows going? we find the list of NICs where our GDP on PPP per capita match with Philippines, near to Indonesia also. here, is the Philippines-Indonesia also the countries where poor don't sleep hungry? hows many countries would be in world where poor don't sleep hungry? my last posts :-)
.
 
.
hows going? we find the list of NICs where our GDP on PPP per capita match with Philippines, near to Indonesia also. here, is the Philippines-Indonesia also the countries where poor don't sleep hungry? hows many countries would be in world where poor don't sleep hungry? my last posts :-)
.

Why you Indian like to manipulate the data ? @Bilal9

LOL Indian manipulate the GDP PPP percapita by adding it with additional 1295 USD :bunny:

Wikipedia (every body can edit, including Indian)

1699273835564.png


IMF October 2023 projection

Indonesia
1699273964797.png


India
1699274025409.png


Why you Indian like to manipulate the data ? @Bilal9

LOL Indian manipulate the GDP PPP percapita by adding it with additional 1295 USD :bunny:

Wikipedia (every body can edit, including Indian)

View attachment 968984


IMF October 2023 projection

Indonesia
View attachment 968986

India
View attachment 968987


@Indos brother - more of these data manipulators will come out of India when the present supply gets exhausted.

They need these data fudgers because this is Modi's primary source of propaganda for votes.

Almost no one checks the veracity of Indian propaganda and doctored reports.

In the last five years, this trend has gotten unbelievable.

There has been plenty of reports on this subject in global media, Indians don't care.

As you have seen - I have supplied proof of this so many times.

Here is a recent report that says their projection of 7.8% GDP growth is in fact 4.5% and that "underlying issues such as rising inequalities, job scarcity, and a decline in manufacturing jobs persist."


It's like they have an almost unending source of these less than clueful people in India who will chest-beat and jump up and down on false bravado.
 

U.S. National Debt Over Time​

Debt%20Rises%20and%20Fall_Debt%20Held%20By%20Public[1].jpg


The National Debt has always been an area of interest for the United States; President George Washington appointed future President Alexander Hamilton to understand and solve the $80 million debt that had accrued due to the Revolutionary War. Hamilton came up with the plan to pay off the debt through taxes and the creation of the national bank. Since then the United States has steadily increased its budget deficit, and the national debt has continued to rise.
The first time that the national debt hit the $1 billion mark was in 1863 while the Civil War was occurring; it hit the $2 billion was two years later when the civil war ended in 1865. As the country went to battle during World War I and World War II, the national debt hit the $10 billion mark and $100 billion marks respectively. By 1982 after the Vietnam War and the Cold War, the national debt hit the $1 trillion mark for the first time in history. By the 21st Century, the national debt got to $20 trillion after major events such as the War on Terror and the Great Recession. Today (as of May 2023), the national debt stands at $31.5 trillion and public debt is roughly 100% of the country's GDP. :-)


how you look on US's Public debt, its nearly 100% of GDP. they won't ever be able to pay back this much, i guess...... its nearly $33tn+ in debt clock of US :-)


Timeline of U.S. Federal Debt Since Independence Day 1776​

As we get closer to America’s 245th year of independence, it’s a good time to reflect on how debt is woven into our country’s fabric. Especially since we’re now weaving it faster than Betsy Ross ever sewed that first American flag.

Thanks to the cavalcade of economic relief bills prompted by the COVID-19 crisis, the federal debt hit $28.2 trillion in 2021, according to the Congressional Budget Office. That’s an increase of almost $7 trillion in two years.

Consider that our entire national debt didn’t hit $7 trillion until 2004 :-). In other words, the U.S. has accumulated as much debt in the past two years as it did in its first 228 years.

If the debt were a car and America suddenly had to pay for it, every man, woman and child would quickly have to come up with $85,200. Either that, or the country would be repossessed.

Our Founding Fathers knew debt would be part of the game, though their calculators did not have the 13 digits required to signify one trillion.

Shortly after the American Revolutionary War (1775-1783), public debt grew to more than $75 million and continued to swell considerably over the next four decades to nearly $120 million. However, President Andrew Jackson shrank that debt to zero in 1835.

It was the only time in U.S. history when the country was free of debt.

More than 200 years after the inception of our country and several wars, stock market crashes, powerful companies suffering from failed investments, rising unemployment rates, the famous bursting of a tech bubble, the bursting of a housing bubble and pandemic relief bills, federal debt is careening toward $30 trillion.
If Thomas Jefferson had a calculator, it would have read $30,000,000,000,000.


List of National Debt by Country​

  • This is a list of the gross national debt of 178 countries, showing the variation in debt levels from Venezuela at 304% of GDP to Macau at 0% of GDP.
  • National debt refers to the amount of total government debt a country has. This is also referred to as ‘public sector debt’.
  • It is compiled using data from the IMF.

Debt of selected economies​

View attachment 960636

.=>

List of National Debt by Country​

Levels of general gross government debt. Debt levels as % of GDP for 2021 (² unless stated)

RankCountryDebt levels as % of GDP for 2021
1Venezuela ²304
2Japan256.5
3Sudan211.7
4Greece210.1
5Eritrea175.6
6Suriname157.4
7Italy157.1
8Lebanon ²154
9Barbados143
10Maldives139.7
11Cabo Verde137.6
12Belize134.6
13United States132.8 :-)
14Portugal131.4
15Singapore129.5
16Bahrain129.4
17Mozambique125.3
18Bhutan123.4
19Zambia118.7
20Spain118.4
21Canada116.3
22Belgium115.9
23France115.2
24Cyprus113
25Angola110.7
26United Kingdom107.1
27Sri Lanka105.4
28Argentina (2)103
29Brazil98.4
30Jamaica96.5
31Dominica96.4
32Montenegro94.6
33Egypt92.9
34Jordan91.2
35Tunisia91.2
36Congo, Republic of90.5
37Bahamas, The88.6
38El Salvador88.2
39Mauritius87.7
40Pakistan87.7
41Austria87.2
42India86.6
43Croatia86.3
44Fiji83.6
45Iceland82.5
46Ghana81.5
47South Africa80.8
48Slovenia80.5
49Hungary80
50Israel78.3
51Guinea-Bissau78.1
52Mongolia77.9
53Morocco77.1
54Malawi76.8
55Burundi75.6
56Albania75.4
57Grenada74.5
58Gambia, The73.9
59Kyrgyz Republic73.4
60Yemen73
61Costa Rica72.5
62São Tomé and Príncipe72.4
63Australia72.1
64Kenya71.5
65Namibia71.4
66Oman71.3
67Gabon71.1
68Germany70.3
69Armenia69.9
70Iraq69.7
71China, People’s Republic of69.6
72Bolivia69
73Finland68.8
74Lao P.D.R.68.3
75Uruguay68
76Malaysia67
77Senegal66.8
78Dominican Republic66.6
79Rwanda66
80Ecuador65.1
81Puerto Rico64.8
82Colombia64.2
83Slovak Republic64
84Emerging market and developing economies64
85Georgia63.9
86Algeria63.3
87Ireland63.2
88Trinidad and Tobago62.1
89Panama61.4
90Mexico60.5
91Togo60
92Qatar59.8
93Serbia59
94Ukraine58.1
95Malta57.9
96Poland57.4
97Liberia57
98Mauritania56.3
99Netherlands56.1
100Ethiopia56
101Thailand55.9
102Honduras53.9
103North Macedonia53.8
104Korea, Republic of53.2
105Romania52.6
106Philippines51.9
107Zimbabwe51.4
108Lesotho49.8
109Tajikistan49.8
110Nepal49.6
111Papua New Guinea49.6
112Lithuania49.5
113Myanmar49.1
114Samoa49
115Uganda48.8
116Vietnam48
117West Bank and Gaza47.9
118Benin47.7
119Nicaragua47.6
120Latvia47.2
121South Sudan, Republic of47
122Madagascar46.9
123Burkina Faso46.8
124New Zealand46.4
125Côte d’Ivoire46.3
126Mali46.1
127Belarus45.7
128Switzerland44.8
129Niger44.5
130Equatorial Guinea44.1
131Czech Republic44
132Tonga43.7
133Cameroon42.5
134Guinea42.3
135Uzbekistan42.3
136Central African Republic42.2
137Chad41.7
138Denmark41.6
139Norway41.6
140Guyana41.4
141Indonesia41.4
142Sweden40.4
143Bangladesh40.2
144Djibouti40.2
145Moldova39.5
146Bosnia and Herzegovina38.6
147Tanzania37.9
148Turkey37.1
149United Arab Emirates37.1
150Iran36.6
151Paraguay35.7
152Peru35.4
153Chile33.6
154Cambodia33.4
155Guatemala33.1
156Taiwan Province of China32.5
157Nigeria31.9
158Saudi Arabia31
159Azerbaijan30.9
160Kazakhstan27
161Luxembourg26.8
162Haiti26
163Turkmenistan26
164Bulgaria25.5
165Botswana25.3
166Estonia25.1
167Marshall Islands23.3
168Kiribati21.4
169Russian Federation18.1
170Micronesia, Fed. States of15.3
171Timor-Leste15
172Kuwait13.7
173Congo, Dem. Rep. of the12.4
174Tuvalu11.8
175Afghanistan8.8
176Brunei Darussalam2.3
177Hong Kong SAR0.9
178Macao SAR0
All debt levels apply to 2021, except ² No figures for 2021. Debt given for 2020

Source: IMF DataSet, accessed 1 September 2021
.
=>

Highest levels of Government debt in the world​

View attachment 960637

Problems of national debt​

High levels of national debt can cause these potential problems

  1. Requirement of higher taxes and/or lower spending
  2. Higher debt interest payments
  3. Pressure to print money – causing inflation.
  4. Debt financed by overseas borrowing can lead to external pressure
  5. Crowding out of the private sector
See: more problems of government borrowing

How much can a government borrow?​

  • Japan’s national debt is 265% of GDP and has been high for a couple of decades. This reflects the ability of Japan to borrow from domestic citizens. Despite prolonged periods of high debt, interest rates are still low because markets feel the government is still solvent.
  • A developing economy like Argentina has a track record of default on debt, therefore markets are less willing to lend money to the government. Therefore when debt levels in Argentina increase it has a greater effect on pushing up interest rates.

Factors that depend on how much a government can borrow include​

  • Default rates of government
  • Inflationary pressures. High inflation will make investors less willing to buy government bonds because they will devalue due to inflation
  • Can the government print its own money? If the government can print money it can avoid liquidity issues, though there is potential danger of inflation.
  • What are the prospects for economic growth? Higher economic growth makes it easier to reduce debt to GDP ratios over time.
  • How much can a government borrow?

Difference between debt and deficit​

Government debt is the total amount of outstanding liabilities. The deficit is the annual amount by which spending exceeds income. The debt is the accumulation of past deficits.

For example in 2020, the US deficit was $3.13 trillion. The US total debt is $29 trillion.

Causes of national debt​


View attachment 960638

This graph for US national debt shows how national crisis leads to a rise in government borrowing. This isn’t necessarily a bad thing. Government debt enabled the US government to finance the short-term costs of the two world wars. It also enabled the government to respond to the crisis of the 2008 financial crash and the 2020 Covid crisis. Causes of national debt can include

  • Recession – tax revenues fall when the economy shrinks. Also the government spend more on unemployment benefits
  • Investment – Governments might borrow to build new roads, schools and hospitals.
  • Finance war –
  • Demographic changes and welfare spending. An ageing population tends to place more strain on government finances with older people requiring more health care spending, pensions and also they pay less income tax.
  • Political decisions. Some governments may support higher spending on welfare programmes, whearas other governments may target a balanced budget.


Timeline of U.S. Federal Debt Since Independence Day 1776​

As we get closer to America’s 245th year of independence, it’s a good time to reflect on how debt is woven into our country’s fabric. Especially since we’re now weaving it faster than Betsy Ross ever sewed that first American flag.

Thanks to the cavalcade of economic relief bills prompted by the COVID-19 crisis, the federal debt hit $28.2 trillion in 2021, according to the Congressional Budget Office. That’s an increase of almost $7 trillion in two years.

Consider that our entire national debt didn’t hit $7 trillion until 2004 :-). In other words, the U.S. has accumulated as much debt in the past two years as it did in its first 228 years.

If the debt were a car and America suddenly had to pay for it, every man, woman and child would quickly have to come up with $85,200. Either that, or the country would be repossessed.

Our Founding Fathers knew debt would be part of the game, though their calculators did not have the 13 digits required to signify one trillion.

Shortly after the American Revolutionary War (1775-1783), public debt grew to more than $75 million and continued to swell considerably over the next four decades to nearly $120 million. However, President Andrew Jackson shrank that debt to zero in 1835.

It was the only time in U.S. history when the country was free of debt.

More than 200 years after the inception of our country and several wars, stock market crashes, powerful companies suffering from failed investments, rising unemployment rates, the famous bursting of a tech bubble, the bursting of a housing bubble and pandemic relief bills, federal debt is careening toward $30 trillion.
If Thomas Jefferson had a calculator, it would have read $30,000,000,000,000.

.
 
That's quite a disingenuous and misleading statement, only multimillionaires and billionaires are better off, most Americans can't even afford $500 emergency.

Incomes for workers have been stagnant since the late 70s and high inflation has killed their remaining purchase power.
not sure about America getting richer but it is definitely getting more expensive, you know something feels off when you see a simple dish of 西红柿炒蛋 cost $30 in a Seattle restaurant when it's usually $2 in China

US will have to start from beginning say, 1.0US$=1.0 Ruble
i find US$ would at least start from here
 
So called US growth is only on paper through currency manipulation.
.
Might be not yet but its just a matter of few months if not few weeks, from now.

At the end of this decade we will be close to 8 to 9 trillion for sure.

we share a risk during this decade that 1.0US$ may level 1.0Ruble.....
American government is manipulating US$ value at present.
at present, 1.0US$ won't be more than 1.0 Yuan :no:

So called US growth is only on paper through currency manipulation.

a truth which is written on wall.
US-west dont count 'un-documented' part of GDP of developing countries, with their currency manipulation :usflag:
 
Last edited:
If capitalism is so easy then why don't everyone do it and be rich?

China can return to anything it wants to because its really none of your business. You should worry more about Americans and Israelis dropping bombs on you while you defend Mossad and CIA lol

growth story of China was not only hefty investment but also export driven growth, CHina adopted since 80s. CHina has share of export money/foreign money in its GDP.
India is said to be coping with Chinese imported products in 7 to 9 years margin..... If Indian trade deficit is high, with China also, then we find that we are hardly catching up with imported products. and if US-nato fall, then only it means that India's high trade deficit will also fall. :wave:
while China? they know that heavily indebted US-west borrow debt to import Asian-Chinese-Vietnamese products :coffee:
 
View attachment 1030726

A good explanation on why nominal GDP is the only measure to assess relative strength of countries economies.

i have a reliable source to confirm that US is no more in top 2 of the economies in the IMF source as below. :wave:

it also said that China would be on first place while India shows less impact of 'bubble' US-nato economies. and this way, it confirm that there is a chance that USA has slipped to 4th place, below to Russia who has share of SU states also :coffee:

j04xg6s4jb06indbesqsd7kquz4s7hu[1].png


View attachment 1030726

A good explanation on why nominal GDP is the only measure to assess relative strength of countries economies.
it also confirmed that 1.0US$ is measured below 1.0 Yuan value.
it said, this way, US economy is in fact less than half to Indian economy size on PPP :-)
 
Last edited:

Back
Top Bottom