What's new

American Economy News & Updates

Five Charts: U.S. Home Prices Are Cooling Off - Real Time Economics - WSJ

  • wsj_print.gif
  • October 28, 2014, 2:28 PM ET
Five Charts: U.S. Home Prices Are Cooling Off
ByNick Timiraos
The rate of U.S. home price increases is decelerating, and that home-price slowdown is a mixed bag.

It looks unlikely for now, but if prices turn negative again year-over-year, that would exact a toll on would-be buyers’ psyche. A sharp run-up in prices, meanwhile, has dented affordability and is one reason the entry-level buyer has been absent.

The best scenario: price gains advance at their current slower-but-steady pace. “In housing, boring is better,” writes Zillow’s Stan Humphries.

Five charts help tell the story.
BN-FG083_SHILLE_G_20141028111051.jpg

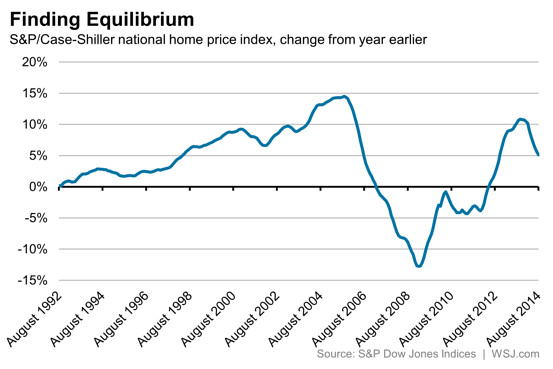
Prices fell sharply during the crash as supply greatly exceeded demand, especially as foreclosures overwhelmed the market. These properties tend to sell for less than traditional properties because they’re not as well maintained and mortgage companies aren’t emotional about selling in the way traditional owners might be.

But over the past two years, prices rebounded. The share of homes selling out of foreclosure was falling, and those properties had attracted growing interest from investors, which supported prices. Meanwhile, low interest rates and pent-up demand from traditional buyers led to bidding wars.
BN-FG084_SHILLE_G_20141028111241.jpg

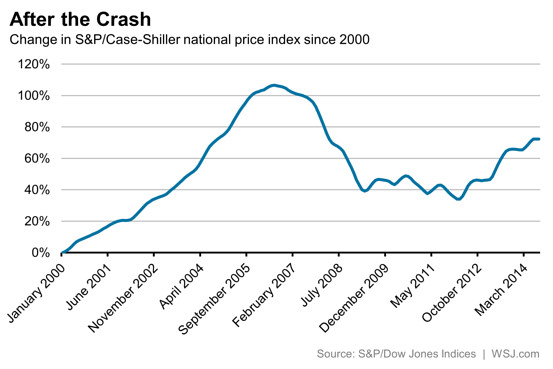
Now the market has cooled down. The monthly increases have slowed considerably over the past four months.

Of course, there’s a strong seasonal component to housing, with more activity—and price gains—during the spring and summer. Looking at prices over the same time period in each of the last 13 years helps clarify the picture. Since December, prices are up 5.2%. That’s less than during the frenzy of the last two years or the bubble of the past decade.

BN-FG082_SHILLE_G_20141028110940.jpg

The big question now is whether these year-over-year increases slow even further and if so, where they might find equilibrium. (A reminder: the Case-Shiller index is reported with a two-month delay, and it’s a three-month moving average of prices. That means prices in Tuesday’s report cover the three-month period ending in August, and those homes would have gone to contract in the late spring or early summer.)

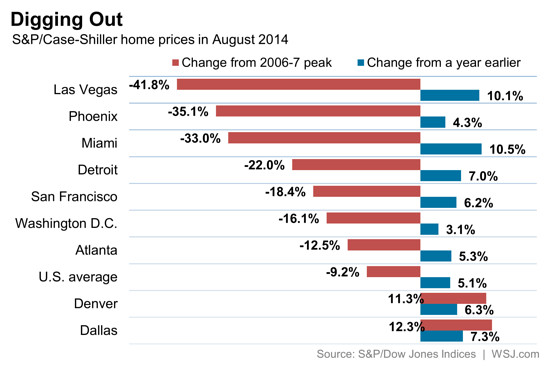
Prices are still rising on a year-over-year basis in all 20 cities tracked by the index, but the pace of gains has slowed in nearly all of them. And in many cities, such as Miami and Las Vegas, prices are still down considerably from their peaks of 2006.
BN-FG094_SHILLE_G_20141028112617.jpg

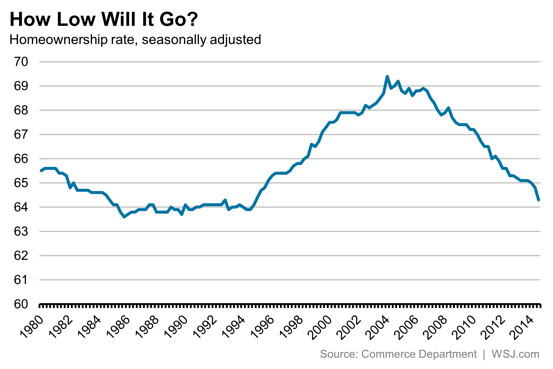
Rising prices, of course, make homes less affordable to entry-level buyers. A separate report from the Commerce Department on Tuesday showed that the homeownership rate dropped again to 64.4%, the lowest level since 1995.
BN-FG087_HOMEOW_G_20141028111351.jpg
 
Microsoft to Cut 18,000 Jobs, Fires Entire Advertising Sales Division
191735368.jpg
Microsoft's Advertising global sales team is facing redundancy, as a part of the latest round of large-scale layoffs, with company expecting to release up to 18,000 workers.

© AP Photo/ Ted S. Warren
10:14 01/11/2014


MOSCOW, November 1 (RIA Novosti) – Microsoft's Advertising global sales team is facing redundancy, as a part of the latest round of large-scale layoffs, with company expecting to release up to 18,000 workers.

"We've taken another step that will complete almost all the 18,000 reductions announced in July. The reductions happening today are spread across many different business units, and many different countries," a Microsoft spokesperson told Business Insider.

Microsoft has already closed both its Global Agencies and Accounts team, responsible for communications with top media agencies, and Yarn, the company's "creative group that collaborates, ideates, incubates and customizes highly immersive ad experiences made possible by Microsoft technology," CRN, the tech news web site reported on Thursday, October 30. A day later, Business Insider revealed that the company had fired its entire global Advertising team, which was "selling advertising space across Microsoft's MSN, Bing, Xbox, Outlook, Skype, and Windows 8 properties." CRN notes that it remains unclear whether the employees were laid off or redirected to others Microsoft's units, adding that the IT giant "could not be reached" for further comments on the issue.

Experts stress that the advertising team layoff will seriously affect Microsoft's competitiveness, noting that companies such as Oracle, Salesforce.com, Google are steadily improving their marketing portfolios. Furthermore, Microsoft is evidently risking loss of a prospective market niche.

"For Microsoft to lose that muscle, connecting with the agencies and CMOs making technology buying decisions, is a big deal. Oracle and Salesforce.com have been building marketing channels for years. They now have the tools and technology to go from the CRM system all the way out to touch the actual customer," an unnamed source told CRN, speaking on condition of anonymity.

On the other hand, according to the eMarketer figures, Microsoft only has a 2-3 percent share of the worldwide digital ad market, while Google dominates with a 31 percent share and Facebook accounts for about 8 percent. "Microsoft's display-ad business has grown increasingly insular over the past few years, which may be to blame for its declines," AdAge, a global advertising news agency points out.

CRN's unnamed source deems that Microsoft A&O (Advertising & Online) had eventually turned into a "dead horse": "Where are the relevant players in advertising today? Google and Facebook. Then you have Microsoft A&O, which has been losing talent and is seen in the space as a dead horse."

However, Business Insider underscores that the executive team of the Microsoft Advertising division is still "on board" and that could mean the IT giant is not ready to leave the prospective global digital ad market yet.
 
Warner Bros. Layoffs This Week


by William D'Angelo, posted 1 hour ago / 343 Views
Warner Bros. CEO Kevin Tsujihara has released a memo to employees that the company will start laying off employees this week, according to GameInformer. No specific group was mentioned, but that "most business groups" will be affected.

"These are difficult decisions, and we don’t take them lightly," said Tsujihara in the memo. "We examined every aspect of our businesses to ensure that we were restructuring in a way that would allow us to minimize the impact on our employees, while continuing to adapt to the changing global marketplace."

The layoffs will continue through the first quarter of 2015. International branches of Warner Bros. will also be affected, however those layoffs will not be known until next year.

Last month developer Turbine, known for developing Infinite Crisis, was hit with layoffs. Though the total number of people laid off is not known.

________________________________________
 
Buck to the future
Is the dollar starting another long-term rally?
20141011_FND001_0.jpg

SUDDENLY the dollar is the currency of the moment. The greenback has risen 6.3% on a trade-weighted basis over the past three months. It recently hit a six-year high against the yen and a two-year high against the euro.

The trend reflects confidence in the prospects for the American economy, combined with worries about the health of the rest of the world. On October 7th the IMF lowered its forecast for global growth in 2014 to 3.3% from the 3.7% it foresaw in April. Some of the biggest reductions were in Europe: it now expects France to grow just 0.4% this year, half a percentage point less than in July. To confirm the fund’s pessimism, German industrial production fell 4% in August while factory orders dropped by almost 6%; both were the biggest declines in more than five years. In contrast, the latest American data showed a 248,000 jump in jobs in September and a fall in the unemployment rate to 5.9%.
This relatively strong economic performance has reinforced expectations that the Federal Reserve will start to push up interest rates next year while the European Central Bank and the Bank of Japan will keep them low. Higher rates will attract investors to the dollar, particularly those who follow a strategy dubbed the “carry trade”, in which they borrow money in a country with low rates and invest it in a country with higher ones.

The carry trade has been difficult in recent years because nearly all countries in the rich world have held rates close to zero. But there is now a significant carry in the bond markets, where ten-year Treasury bonds yield one-and-a-half percentage points more than German bonds of the same maturity—a very wide gap by historical standards.

20141011_FNC852.png

A stronger economy also makes American companies more appealing to international investors. America’s stockmarkets have outperformed their rivals in Europe and Japan this year, even before the strength of the dollar is taken into account. Foreign firms have bid a combined $325 billion for American firms this year. That increases the demand for dollars.

The big question, however, is how long this trend will last. As the chart shows, the latest rebound is small by the standards of the huge rallies in the early 1980s and the late 1990s. A strengthening dollar has its advantages for Americans. Foreign investors will be keener to hold Treasury bonds, making it easier for the government to fund its deficit. American tourists will find their money goes further on foreign trips. Imports will fall in price, keeping inflation down despite the healthy economy.

But there are downsides too. American companies will find that their overseas profits are worth less in dollar terms; around a third of the revenues of S&P 500 companies come from abroad, according to Factset, a data firm. America’s exports will be less competitive, at a time when the country still has a current-account deficit of 2.3% of GDP, despite the boom in shale oil. As a result, a big appreciation of the dollar cuts GDP growth by around half a point over the following year, according to the Fed’s models. (This may mean the Fed is slower to tighten policy than the markets expect, a factor that may eventually limit the dollar’s rise.)

A stronger dollar will have the opposite effect on the European and Japanese economies, making their exports cheaper and pushing up import prices. Policymakers in both areas may welcome that, since they are struggling to generate growth and avoid deflation. As David Bloom, head of foreign-exchange strategy at HSBC, a bank, says, “The dollar on its own may not be able to save the world but it will certainly buy these economies time.”

For emerging markets, the effect is probably less positive. Back in 2010 Guido Mantega, Brazil’s finance minister, warned that loose monetary policy in America and elsewhere was leading to “currency wars” in which rich countries were trying to improve the competitiveness of their exports by devaluing their currencies. Investors were also pouring money into emerging markets, enticed by their better growth prospects, leading some countries (including Brazil) to impose capital controls. A stronger dollar may now prompt capital to flow out of such countries just as fast. That will be a particular problem in places where governments or firms have borrowed significantly in dollars, since their revenues are denominated in local currency but their liabilities in dollars.

A prolonged dollar rally may also have political ramifications. A paper by Douglas Campbell of the University of California, Davis, found that the previous two big dollar surges led to a decline in manufacturing jobs. That provoked complaints from American politicians that first Japan and then China were unfairly suppressing their currencies to take American jobs. It is easy to imagine the same arguments resurfacing this time, with the obvious target being Germany. It already has a current-account surplus of 7.2% of GDP; the euro’s recent weakness is likely to boost it further. Governments resisted calls for protectionism in the past, but their economies were stronger then. It may be harder to ward off in future, given that voters have already been angered by years of austerity and declines in inflation-adjusted wages.
 
TASS: Economy - Russia cuts investments in US government securities to $117.7 billion

November 19, 10:07 UTC+3
Russia still keeps its 12th place in the list of the major foreign holders of American securities
WASHINGTON, November 19. /TASS/. Russia has reduced its investment in US government securities by $400 million to $117.7 billion, according to September data from the US Department of the Treasury published on Tuesday.


Russia still keeps its 12th place in the list of the major foreign holders of American securities. China ($1.26 trillion) is the largest holder of US securities, followed by Japan, which has slashed its holdings of US Treasuries to $1.23 trillion.

Among the top foreign holders of US securities are Belgium, a group of offshore states of the Caribbean, OPEC countries, Brazil, Switzerland, Taiwan, the United Kingdom and Hong Kong. Luxembourg comes in the 11th place ahead of Russia.

In general, foreign buyers in September significantly reduced their investment in US securities, with the overall figure estimated at $6.06 trillion. In August, the figure stood at $6.07 trillion.

Apart from countries, US securities are owned by foreign entities and individuals, as well as domestic companies, funds and private investors. US Treasury securities are issued to allow the government to finance the federal budget deficit.
 
Dream of U.S. Oil Independence Slams Against Shale Costs
By Asjylyn Loder Feb 27, 2014 1:00 AM GMT+0100


Photographer: Andrew Burton/Getty Images
Drilling for oil in the Bakken shale formation on July 23, 2013 outside Watford City, North Dakota.

The path toward U.S. energy independence, made possible by a boom in shale oil, will be much harder than it seems.

Just a few of the roadblocks: Independent producers will spend $1.50 drilling this year for every dollar they get back. Shale output drops faster than production from conventional methods. It will take 2,500 new wells a year just to sustain output of 1 million barrels a day in North Dakota’s Bakken shale, according to the Paris-based International Energy Agency. Iraq could do the same with 60.

Consider Sanchez Energy Corp. The Houston-based company plans to spend as much as $600 million this year, almost double its estimated 2013 revenue, on the Eagle Ford shale formation in south Texas, which along with North Dakota is one of the hotbeds of a drilling frenzy that’s pushed U.S. crude output to the highest in almost 26 years. Its Sante North 1H oil well pumped five times more water than crude, Sanchez Energy said in a Feb. 17 regulatory filing.Shares sank 7 percent.

“We are beginning to live in a different world where getting more oil takes more energy, more effort and will be more expensive,” said Tad Patzek, chairman of the Department of Petroleum and Geosystems Engineering at the University of Texas at Austin.


Photographer: Eddie Seal/Bloomberg
Tony Sanchez, chief executive officer for Sanchez Energy Corp., left, speaks at the...Read More

Drillers are pushing to maintain the pace of the unprecedented 39 percent gain in U.S. oil production since the end of 2011. Yet achieving U.S. energy self-sufficiency depends on easy credit and oil prices high enough to cover well costs. Even with crude above $100 a barrel, shale producers are spending money faster than they make it.

Missed Forecasts
Companies are showing the strain. Chesapeake Energy Corp., the Oklahoma City-based company founded by Aubrey McClendon, reported profit yesterday that missed analysts’ forecasts by the widest margin in almost two years. Shares declined 4.9 percent. Fort Worth, Texas-based Range Resources Corp. fell 2.3 percent after announcing Feb. 25 that fourth-quarter profit dropped 47 percent. QEP Resources Inc., a Denver-based driller, slid 10 percent after fourth-quarter earnings reported Feb. 25 fell short of analysts’ predictions.

Rethinking the Ban on Exporting U.S. Oil

The U.S. oil industry must sprint simply to stay in place. U.S. drillers are expected to spend more than $2.8 trillion by 2035 even though production will peak a decade earlier, the IEA said. The Middle East will spend less than a third of that for three times more crude.


Photographer: Eddie Seal/Bloomberg
Floor hands operate an oil rig in the Eagle Ford Shale formation area near Texas.

Bulls Crow
Shale wells can vary in price. Chesapeake will spend an average of $6.4 million each this year, according an investor presentation last updated yesterday. Houston-based Goodrich Petroleum Corp.will spend up to $13 million on some of its wells, Robert Turnham, president and chief operating officer, said in a Feb. 20 earnings call.

Bullish analysts and oil executives have reason to crow. While drilling in Iraq could break even at about $20 a barrel, output will be limited by political risks, Ed Morse, global head of commodities research at Citigroup Inc. in New York, said in a January report. By contrast, the break-even price in U.S. shale is estimated at $60 to $80 a barrel, according to the IEA. The price of a barrel hasn’t dipped below $80 since 2012 and has stayed above $90 since May. Costs in the U.S. will continue to fall as drillers get faster and improve results, Morse said.

Crude Exports
“The U.S. oil and natural gas renaissance is receiving significant investment because return on investment is good and competitive with other opportunities,” Rick Bott, president and chief operating officer of Oklahoma City-based Continental Resources Inc., a pioneer of shale drilling, said in an e-mail. “We’re confident that continued technological advancements will keep the Bakken and other plays at the forefront of investment for the foreseeable future.”

Harold Hamm, the chairman and chief executive officer of Continental Resources who became a billionaire drilling in North Dakota, told U.S. lawmakers Jan. 30 that the country, which U.S. Energy Information Administration data show supplied 86 percent of its own energy last year, can drill its way to energy independence by 2020. Hamm is leading an effort to get Congress to allow crude exports for the first time since the 1970s.

U.S. oil production will average 9.2 million barrels a day in 2015, up from 7.4 million last year, according to the EIA, the statistical arm of the U.S. Energy Department. Colorado boosted output by 11 percent in the first 11 months of last year, Wyoming was up 12 percent and Oklahomaadded 24 percent.

“I don’t see the shale boom coming to an end,” said Andy Lipow, president of Lipow Oil Associates, an energy consulting firm in Houston. “We’re just getting started in places like Colorado, Wyoming and Oklahoma.”

Horizontal Wells
Sanchez Energy said in a Feb. 19 statement that Sante North 1H isn’t yet finished and the well will produce more oil than the early report suggested. The company said it has 120,000 acres in the Eagle Ford and plans to spend 90 percent of its exploration budget there this year. The company’s shares have risen 63 percent in the past year.

Traditional wells are bored straight down, like straws stuck into large deposits of crude. Shale is tapped by steering the drill horizontally through layers of oil-rich rock, sometimes for a mile or more. The formation is blasted apart with a high-pressure jet of water, sand and chemicals, a practice called hydraulic fracturing or fracking, to open up cracks that free pockets of trapped fuel. The complexity and materials needed to drill horizontally and blast the rock add to the cost.

Yield Little
The boom’s boosters have given rise to the misconception that wringing oil and gas from shale can be easily replicated throughout the country, Patzek said. That isn’t the case, he said. Every rock is different. The Bakken shale, along with the neighboring Three Forks formation, covers an area larger than France, according to the IEA. An oil-bearing formation that’s 400 feet (122 meters) thick in one spot may taper off to nothing just a mile away, Patzek said. What works for one well may yield little in a neighboring county.

The output of shale wells drops faster, too, falling by 60 to 70 percent in the first year alone, according to Austin, Texas-based Drillinginfo Inc. Traditional wells take two years to fall by about 55 percent before flattening out. That forces companies to keep drilling new wells to make up for lost productivity.

“You keep having to drill more and you keep having to spend more,” said Mark Young, an analyst with London-based Evaluate Energy, which tracks production and its costs.

Sweet Spots
A prolonged slide in prices below $85 a barrel may put pressure on operators that have struggled to contain costs or that don’t own acreage in the prolific “sweet spots” of the oil fields, said Leonardo Maugeri, a former manager at Rome-based energy company Eni SpA who’s researching the geopolitics of energy at Harvard University’s Belfer Center for Science and International Affairs.

Companies have boosted well productivity and will continue to whittle down the break-even price, he said. While the boom could survive a brief dip in oil prices, a long slump could slow drilling and cause production to fall swiftly, Maugeri said.

“To sustain in the short term, the U.S. needs prices at $65 a barrel,” Maugeri said. “That’s a critical level. Below that level, many opportunities will vanish.”

The U.S. benchmark oil contract for West Texas Intermediate crude for delivery in April 2016 is trading at about $85 a barrel, almost $18 a barrel less than today and still $20 above Maugeri’s threshold.

Net Debt
Even with crude prices above $100 a barrel, U.S. independent producers will spend $1.50 drilling this year for every dollar they get back from selling oil and gas and will carry debt that is twice as much as annual earnings, said Ryan Oatman, an energy analyst with SunTrust Robinson Humphrey Inc., an investment bank in Houston.

By contrast, the net debt of Exxon Mobil Corp., the world’s largest energy explorer by market value, is less than half of the cash earned from operations last year. The company will spend 68 cents for every dollar it gets back this year, according to company records and analyst forecasts compiled by Bloomberg.

So far, oil prices have been high enough to keep investors interested in the potential profits to be made in shale, Oatman said.

“There is a point at which investors become worried about debt levels and how that spending is going to be financed,” Oatman said. “How do you accelerate and drill without making investors worried about the balance sheet? That’s the key tension in this industry.”

not worry at all. new experience and technology will continue to make shale more profitable in the future

and we got Venezuela going around OPEC and even Russia begging and pleading for oil to go back to above $100 :rofl::rofl:

oil being this low is temporary and will go back to being over $100 in no time can't say the same for countries who bank on coal and iron ore to rebound like Australia :azn:

oil isn't going to last much longer....the Americas hold most of the unconventional oil..soon we will be calling the shots :devil::devil:
 
US positioned to lead global growth in 2015 - Global Times

With the year-end approaching, the US is expected to overtake the rest of the world in terms of economic growth next year. That is to say, the world's largest economy will likely grow faster than the previous year and notch a rate of increase greater than all other countries and regions.

Throughout the post-financial crisis era, only 2012 saw the US surpass the rest of the world with its economic expansion, with the pace of growth increasing by 0.719 of a percentage point during that year. This figure stands in stark contrast to economic contractions of 0.778 of a percentage point, 0.433 of a percentage point and 1.126 percentage points for the global, developed- and emerging-market economies respectively. Thanks to the US's strong fundamentals, the International Monetary Fund (IMF) estimates that US economic growth will accelerate 0.939 of a percentage point in 2015, outpacing the global, developed- and emerging-market economies.

Relatively high growth, low inflation and stabilizing employment conditions are likely to be the defining characteristics of the US economy next year. The IMF's 2015 forecast of real GDP growth in the country is 3.093 percent, higher than the historic average of 2.65 percent set since 1980. Meanwhile, inflation is expected to reach 2.126 percent next year, slightly higher than the 2 percent target set by the Federal Reserve; yet considering that this figure is based on overestimated oil prices, real inflation will likely fall short of earlier expectations. In addition, estimated unemployment is at 5.945 percent - though this is higher than pre-crisis levels, it marks a big improvement from the 7.91 percent average set during the height of the crisis.

Behind the country's strong recovery are several important domestic factors.

Firstly, the US economy has robust endogenous growth momentum. Although US real GDP contracted 2.1 percent quarter-on-quarter in the first quarter of this year, and later grew by 4.6 percent and 3.5 percent during the second and third quarters respectively, its endogenous growth rates, after the exclusion of confounding factors like inventory fluctuations, international trade and government spending, were 0.87 percent, 3.21 percent and 1.92 percent during the corresponding periods, indicating that recovery has been steady.

Secondly, problems curbing US consumption have been largely eliminated. It goes without saying how important consumption is to the US economy. During the first three quarters of 2014, consumption accounted for 1.27 percentage points of US economic growth, a relatively low level compared with the historic average of 2.09 percentage points.

Slowing income growth was one of the primary drags on consumption. Year-on-year growth in disposable per capita income during the first three months of this year was below 3 percent. Yet, the situation has changed, with the disposable income growing faster than 3 percent from April to September. Consequently, the US consumer confidence index has gradually recovered from 80 in March to 89.4 in November, a high not seen since July 2007.

Thirdly, the US housing market has picked up steam again following a short-term correction. It wasn't until mid-2012 that the US housing market finally started its post-crisis rebound. However, due to strong expectations of an interest rate hike by the Fed, the rebound trend has struggled to gain momentum. The Standard & Poor's/Case-Shiller 20-city home price index declined for four consecutive months from November 2013 to February 2014 before resuming growth from March to September.

Fourthly, consistent improvements have been made this year in the US labor market. The unemployment rate fell from 6.6 percent in January to 5.8 percent in September, while the employment ratio climbed to 59.2 percent from 58.8 percent, with monthly-added-jobs averaging at 269,700, much higher than the historic average of 111,400. Moreover, other indicators such as job vacancy rates and weekly working hours all indicate that there is room available for a further increase in employment.

Fifthly, US industrial output has undergone robust growth. The US industrial production index grew by an average of 3.94 percent year-on-year during the first three quarters, while industrial output rose 3.7 percent over the same period compared with a year earlier.

Of course, challenges still exist for the US economy in 2015, including slow growth in labor productivity and a rising savings ratio. However, the real threats to the US economy may come from political and policy uncertainties. With US President Barack Obama's term coming to an end, signs of wavering public support may lead to a more assertive domestic policy approach, which could in term create new risks for the US economy. Additionally, under the leadership of Janet Yellen, the Fed appears hesitant in terms of its decision making, which is likely to create a big source of uncertainty for the US economic recovery.

The author is a research fellow with Beijing-based think tank Pangoal.

bizopinion@globaltimes.com.cn
 
U.S. economy resilient in Q3 as global growth cools

The U.S. economy grew at a much faster pace than initially thought in the third quarter, pointing to strengthening fundamentals that should help it weather slowing global demand.

The Commerce Department on Tuesday raised its estimate of GDP growth to a 3.9 percent annual pace from the 3.5 percent rate reported last month, reflecting upward revisions to business and consumer spending, as well as to inventories.

The rise in output followed a 4.6 percent advance in the prior three months to mark the two strongest back-to-back quarters since the second half of 2003. It underscored the economy's resilience against a backdrop of a Japanese recession, an anemic euro zone and a slowing China.

"This report will go some way in providing further confirmation about the sustainability of the current economic recovery," said Millan Mulraine, deputy chief economist at TD Securities in New York.

Economists had expected growth would be trimmed to a 3.3 percent pace. When measured from the income side, the economy grew at its fastest pace since the first quarter of 2012.

But the otherwise upbeat picture was marred somewhat by other data showing consumer confidence sliding to a five-month low and a further moderation in house price gains.

U.S. stocks were little changed while the dollar slipped against a basket of currencies. Prices for U.S. Treasury debt rose marginally.

The ebb in consumer confidence in November was surprising given falling gasoline prices and a firming jobs market.

"Economic growth is strong and getting stronger by the day. The consumer gets it, even if they aren't yet saying it," said Chris Rupkey, chief financial economist at MUFG Union Bank in New York.

The third quarter was the fourth out of the past five that the economy has expanded above a 3.5 percent pace, well above the level economists consider to be trend.

Some of the momentum appears to have carried over into the final three months of the year, with data from manufacturing to employment and retail sales suggesting continued strength.

But with inventories rising more than previously estimated in the third quarter, economists expect the pace of restocking to slow, holding growth below a 3 percent pace in the fourth quarter.


STRONG FUNDAMENTALS

Highlighting the economy's strong fundamentals, growth in domestic demand was raised to a 3.2 percent pace from the previously reported 2.7 percent rate.

"This is vindication for the Federal Reserve that they downplayed concerns overseas and it's appropriate to speak about rate hikes next year," said Christopher Low, chief economist at FTN Financial in New York.

The U.S. central bank has kept benchmark borrowing costs near zero since December 2008, but is expected to start raising them around the middle of next year.

Consumer spending, which accounts for more than two-thirds of U.S. economic activity, was revised up to a 2.2 percent pace in the third quarter from the previously reported 1.8 percent rate.

Business spending on equipment was raised to a 10.7 percent rate from a 7.2 percent. While exports grew, the pace was less brisk than previously reported, leaving trade contributing only 0.78 percentage point to GDP growth instead of 1.32 percentage points.

Growth in wages and salaries was revised lower for both the second and third quarters. Economists said that brought the GDP-based wages and salaries measures into line with earnings figures from the government's survey of nonfarm employers.

"This should ease concerns that the Fed was falling behind the curve due to mismeasured wage inflation data," said Michael Feroli, an economist at JPMorgan in New York.


U.S. economy resilient in Q3 as global growth cools| Reuters
 
Last edited:
Manufacturing in U.S. Grew More Than Projected in November

*China, Russia, Japan, the EU, much of the rest of the world slows... the US just keeps picking up steam:usflag::usflag:

Manufacturing in the U.S. expanded in November at a faster pace than projected, signaling the world’s largest economy is rising above a global slowdown.

The Institute for Supply Management’s factory index was little changed at 58.7 last month, the second-strongest level since April 2011, compared with 59 in October, the Tempe, Arizona-based group’s reported today. It exceeded the median forecast of 80 economists surveyed by Bloomberg and readings greater than 50 indicate growth.

Orders over the past four months have been the strongest in a decade as growing demand from American consumers makes up for any letdown among foreign customers. Continued progress in the labor market and the plunge in gasoline prices may give Americans an even greater ability to spend in coming months, supporting manufacturing as the year draws to a close.

“Whatever is happening abroad, this sector seems to be shrugging it off,” said Guy Berger, a U.S. economist at RBS Securities Inc. in Stamford, Connecticut, who projected a reading of 58.5. “There’s always the worry that the weakness in growth abroad eventually starts filtering into it but right now it’s not really obvious.”

The median estimate in a Bloomberg survey of economists called for a decline to 58. Projections ranged from 54.5 to 61. Manufacturing accounts for about 12 percent of the economy.

Stocks fell, sending the benchmark indexes lower for a second day, as data showed Chinese manufacturing slowed last month while fewer shoppers showed up for Black Friday sales events. The Standard & Poor’s 500 Index declined 0.5 percent to 2,056.83 at 10:32 a.m. in New York.

Global Manufacturing

American producers keep powering ahead at the same time their global competitors slow. Factories in Germany, France and Italy unexpectedly shrank last month, according to purchasing managers’ gauges. An index of Chinese manufacturing fell as mandatory plant shutdowns during the Asia-Pacific Economic Cooperation forum aggravated a pullback in the economy.

One standout internationally was the U.K., where manufacturing growth unexpectedly accelerated in November to the fastest pace in four months as domestic demand strengthened.

The U.S. ISM’s orders index climbed to 66 from 65.8 in October. The 64.6 average over the past four months is the highest for a similar period since early 2004.

Even exports showed improvement, with the gauge advancing to 55 from 51.5 in October.

Order Backlogs

Factories are struggling to keep up with demand as the index of bookings waiting to be filled rose to 55, the highest since April, from 53.

Some of the increase in backlogs may be due to inclement weather last month that could have prevented companies from obtaining needed parts. ISM’s supplier deliveries gauge increased to the highest level since February, indicating factories were experiencing more delays in getting materials.

The group’s production gauge barely budged from a 10-year high, decreasing to 64.4 in November from 64.8 the month before.

The measure of factory employment decreased to 54.9 from 55.5 in October.

Lower raw-material costs are another boon for manufacturing. ISM’s prices paid index fell to 44.5, signaling expenses dropped for the first time since July 2013 and by the most since July 2012.

Customer Inventories

One potentially dark cloud in the report was that factories’ clients reported they had about enough goods on hand, suggesting bookings may not pick up much more. The customer inventory index rose to 50, the break-even point between having too much and too little stock. That was its highest reading in three years.

Rockwell Automation Inc. (ROK), the Milwaukee-based maker of software for factories, is among companies that are optimistic about prospects for U.S. manufacturing growth in 2015, even if it does moderate from this year’s pace.

“Our sales tend to move best with the actual industrial production growth rates and probably secondarily with what’s going on with general GDP growth,” Chief Financial Officer Theodore Crandall said at a Nov. 20 investor meeting. On a global scale, “what we’re expecting in terms of the healthiest environment in 2015 is the U.S.”

Gross domestic product grew at a 3.9 percent annualized pace in the third quarter following a 4.6 rate in the prior period, marking the strongest six months of growth in more than a decade, according to figures from the Commerce Department.

Consumer spending, which accounts for about 70 percent of the economy, grew at a 2.2 percent annualized rate in the third quarter up from a previously estimated 1.8 percent. The improvement was spread across durable and non-durable goods, including recreational vehicles and restaurant meals.

Business investment in new equipment climbed at a 10.7 percent annualized rate last quarter, revised up from 7.2 percent, last week’s report showed.

From Manufacturing in U.S. Grew More Than Projected in November - Bloomberg
 

Back
Top Bottom