Homo Sapiens
ELITE MEMBER

- Joined
- Feb 3, 2015
- Messages
- 9,641
- Reaction score
- -1
- Country

- Location
The Numbers
Why Economists Are Still Baffled by India’s GDP Growth
11:17 pm EST Sep 2, 2015
By
Anant Vijay Kala
share
If economists weren’t already baffled by India’s revised gross domestic product data, they probably are now.
This week the government announced the GDP numbers for the first quarter of the financial year started April.
It said the economy grew at 7% compared to a year earlier. That’s an impressive performance but still suspicious, economists say, as some other indicators unveiled with the GDP on Monday suggest India’s economy could be still stuck in a rut.
Here are four indicator mismatches that have economists scratching their heads.
- GVA vs. GDP
7.1%
As part of India’s rejiggering of the GDP numbers this year, it introduced a new measurement called gross value added. The GVA measure aims to remove the distorting impact of taxes and subsidies out of economic output and give a better picture of how the real economy is doing.
Economists had expected GVA growth to be lower than 7.0% and well below GDP growth because of a surge in indirect taxes in the most-recent quarter. Instead it was 7.1%, higher than GDP growth and down from the previous quarter.
Some economists say they don’t understand how GVA growth could have accelerated compared to the previous quarter and risen above GDP growth.
The data is “perplexing,” said STCI Primary Dealership, a market-maker in government bonds. HSBC said the latest data “has come with more questions than answers.”
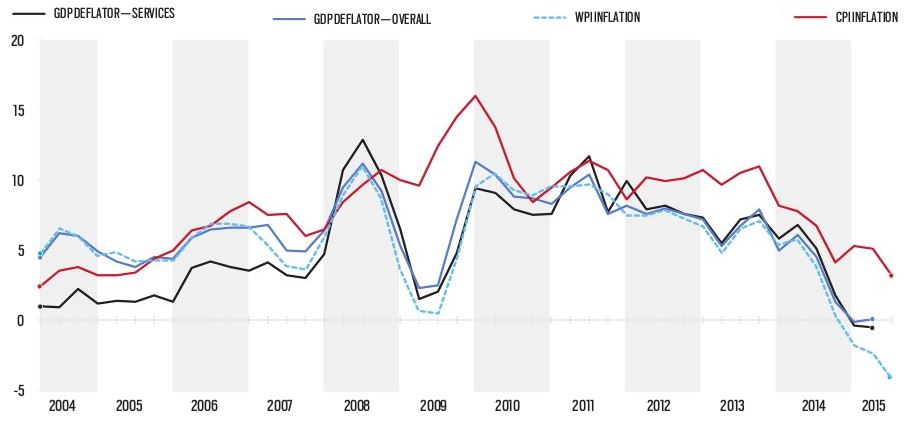
- GDP Deflator vs. Inflation
1.7%
To ensure data for different quarters is comparable, statisticians use what is called a deflator to strip out price changes.
Typically, if inflation rates are rising then the deflator rises with them. But the GDP data this week show the deflator rising at a time when other indicators suggested inflation was cooling.
The deflators rose to 1.7% year-over-year in the quarter ended in June, compared with a 0.2% rise in the prior quarter. During the same period India’s consumer price inflation eased to 5.1% from 5.3% and wholesale prices actually deflated at a higher rate.
“These factors add to broader concern that the new growth series are out-of-sync with [frequently announced] indicators,” said Radhika Rao, an economist at DBS Bank.
- Manufacturing in GDP vs. Industrial Production Data
7.2% vs. 3.6%
According to the GDP release, manufacturing output climbed 7.2% last quarter. That’s robust by any standard, although it marks a slowdown from the 8.4% expansion it recorded in the previous quarter.
But, industrial production data between April and June show that the manufacturing sector rose just 3.6%.
Care Ratings puts it bluntly: the GDP numbers show a favorable and improving domestic economy, the situation observed on the ground is different.
- Construction vs. Cement
0.9%
Finally, and perhaps most befuddling of all, the strong rebound in construction activity begs the question, what did they build with and when did they build it?
The GDP numbers showed construction growing 6.9% year-over-year in the quarter ended in June, compared with a 1.4% year-over-year expansion in the prior three months.
Economists were surprised by the construction figures as unseasonal rains had delayed some projects last quarter.
The construction growth was “surprisingly strong, given the above-average rainfall in these months,” said Aditi Nayar, an economist at rating firm ICRA.
Wet weather often leads to delays on construction sites.
Meanwhile some economists pointed to the fact that demand for construction materials didn’t seem to have kept pace with this growth.
According to India’s infrastructure output data, cement production grew only 0.9% last quarter.


")


")
