PakistaniandProud
FULL MEMBER

- Joined
- Apr 30, 2012
- Messages
- 1,336
- Reaction score
- 0
- Country

- Location

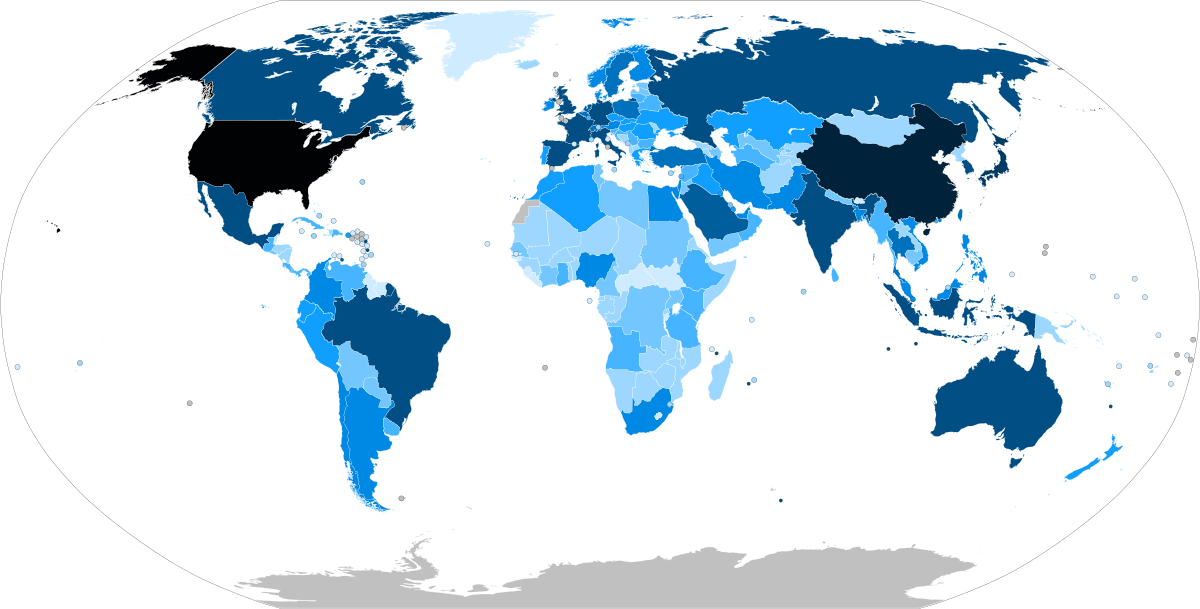
List of countries by GDP (nominal) - Wikipedia
Iran grew nearly 100% from 2020 to 2022 to a GDP nominal output of 1,739,012 (in millions) making it the 14th largest economy in the world, just below Australia. This also makes it the largest economy amongst Muslim nations. Usually, Turkey and Saudi Arabia took this spot nominally while Indonesia took this spot PPP-wise.
Turkey dropped considerably from 720,098 to 692,380 in millions from 2020 to 2022. It currently ranks rank 23 right now below Poland and above Sweden. PPP wise Turkey ranks 11th, the second-highest amongst Muslim majority nations behind Indonesia.
Pakistan ranks 24th PPP-wise, making it the 6th largest amongst Muslim nations below Indonesia, Turkey, Saudi Arabia, Iran, and Egypt.
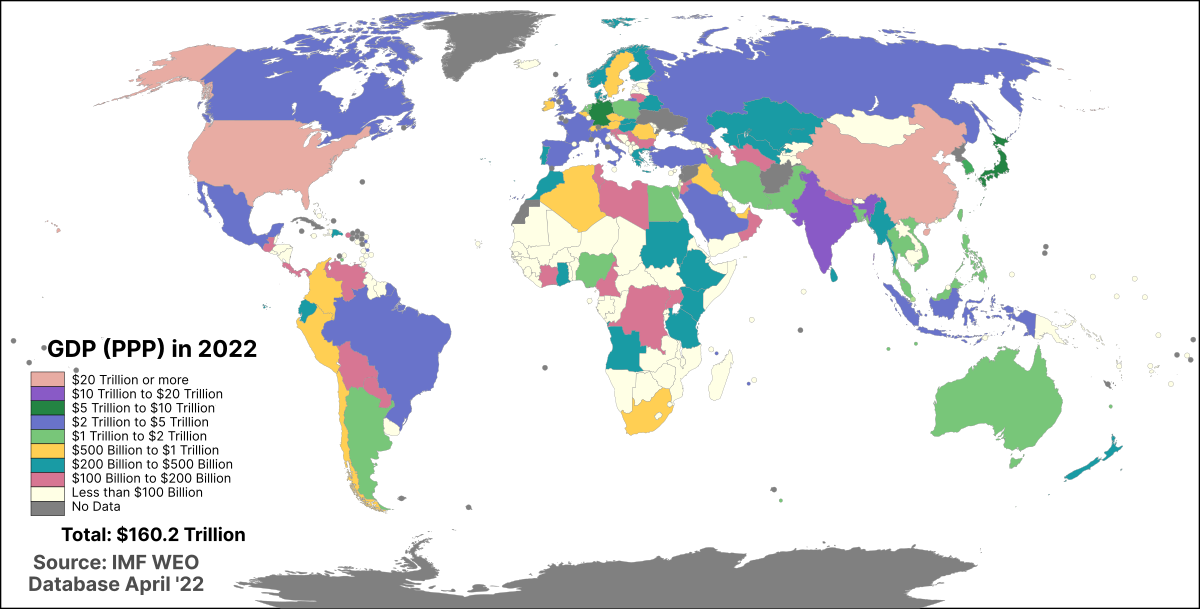
List of countries by GDP (PPP) - Wikipedia
The economic diversifcation of Iran is still really poor as seen below:
Turkey's Economic Diversifcation:
Pakistan's economic diversifaction:
Saudi Arabia's Economic Diversifcation:
Indonesia's Economic Diversifaction:
The United Arab Emirate's economic diversifaction is rather surprising.
Last edited: