What's new

China's life expectancy is now higher than that of the US

beijingwalker

ELITE MEMBER
Joined
Nov 4, 2011
Messages
65,191
Reaction score
-55
Country
China
Location
China

China's life expectancy is now higher than that of the US​

By Mary Hui
Sept. 1 2022

The US’s life expectancy continued its decline from 2020 to 2021, dropping sharply to 76.1 years.

With the latest decline, US life expectancy is now at its lowest since 1996, according to new data (pdf) from the Centers for Disease Control and Prevention’s (CDC’s) National Center for Health Statistics. It also means that the gap in longevity at birth between people in the US and China has now widened to a full year.

微信图片_20220901234524.png

Covid is the main cause of shortened US life expectancy

The biggest driver in the drop in US life expectancy is covid, accounting for 50% of the decline, according to the CDC. Government figures show that as of Aug. 31, over 1.04 million deaths in the US have been attributed to covid.

“Unintentional injuries”—which include opioid overdoses and motor vehicle crashes—were the second-largest contributor to the drop in life expectancy, making up 15.9% of the decline.

Chinese data on life expectancy for 2021 is not yet available. Remarkably, however, Chinese life expectancy actually increased by 0.2 years in 2020 from the year prior. By contrast, US life expectancy fell 1.8 years in 2020 over the same period.

China’s zero-covid strategy has averted staggering mortality

A key reason for the disparity is China’s stringent covid controls, beginning in the early days of the pandemic, with the Wuhan lockdown that began in January 2020, and continuing with today’s aggressive zero-covid policies.

Beijing has repeatedly said that it cannot diverge from its zero-covid approach without further safeguards such as higher vaccination rates, as doing so would risk 1.5 million deaths nationwide. As of March, vast swathes of the elderly Chinese population were still unvaccinated or not fully vaccinated, according to official figures. An attempt to implement a vaccine mandate in Beijing in July was abruptly rolled back.

Still, while China now has several homegrown covid interventions, including an antibody therapy combination and a promising antiviral pill candidate winding its way through the regulatory approval process, Beijing shows no signs of easing off its zero-covid strategy.

 
A true genocide is happening to the point that it cut the average life expectancy of a whole nation!
guns and drugs unfortunately
add in the terrible food

Lets hope politicians come to their senses and stop this madness
 
guns and drugs unfortunately
add in the terrible food

Lets hope politicians come to their senses and stop this madness
Add in the drug crisis too. They’ve have so much money for foreign wars but yet not enough for their own people.
 
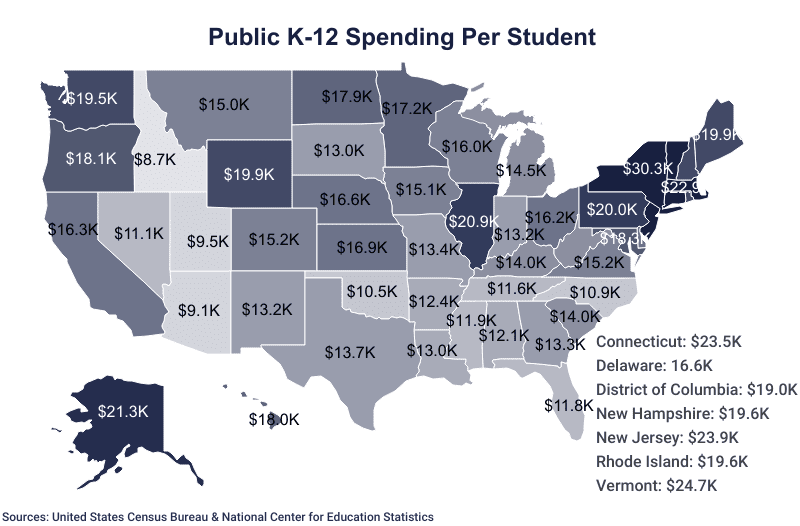
China's education budget is higher because China is 4 or 5 times more populated than USA. I am sure per capita education budget of USA is higher than China


According to your graph education budget of USA is 174 billion dollars and China 604. 604 is only 3.47 times higher than 174. Per capita education spending of USA is higher than China
It's about the percentage of GDP, besides, you have to consider the cost of living in different countries. some reports say for defence budget, one dollar's worth for China amounts to nine dollars in US.
 
It's about the percentage of GDP

Exactly, and your graph is a misrepresentation because it ignores US state/local funding.

1662106776157.png

1662106882104.png


Government expenditure on education, total (% of GDP) - United States, China

1662106442353.png
 

Exactly, and your graph is a misrepresentation because it ignores US state/local funding.

View attachment 875573

View attachment 875575

Government expenditure on education, total (% of GDP) - United States, China

View attachment 875572
China's was also not included, the chart is only for official education budget spending.
 
China's was also not included, the chart is only for official education budget spending.

Nah, it's included. Here's the math.


($3.9tril x 15.5%) / 3.6% = ~$17tril, which roughly matches China's current GDP. Which means your graph for China and my graph for China from the World Bank refers to the same thing.

This is not the case for the US.

Anyway more spending doesn't mean better outcomes. The US is quite notorious for their inefficient spending on health and education in producing better outcomes despite large spending.
 
Nah, it's included. Here's the math.


($3.9tril x 15.5%) / 3.6% = ~$17tril, which roughly matches China's current GDP. Which means your graph for China and my graph for China from the World Bank refers to the same thing.

This is not the case for the US.

Anyway more spending doesn't mean better outcomes. The US is quite notorious for their inefficient spending on health and education in producing better outcomes despite large spending.
From one picture and you concluded private and local government fundings are included? Are you serious? Do you know how many state companies and private sectors fund education in China? besides, that chart is not about detailed overall education industry breakdown, it's about official federal budget on education.
 
From one picture and you concluded private and local government fundings are included? Are you serious? Do you know how many state companies and private sectors fund education in China? besides, that chart is not about detailed overall education industry breakdown, it's about official federal budget on education.

Supposed that you are right, why did you post it then? It's misleading to just present one layer of government's budget, when both countries' political systems are so different, isn't it?
 

Back
Top Bottom