What's new

Maps & Graphics

ghazi52

PDF THINK TANK: ANALYST
Joined
Mar 21, 2007
Messages
101,752
Reaction score
106
Country
Pakistan
Location
United States
Khyber Pakhtukhwa's geographical regions

L74nwqe.jpg


.......................................................................................................

Pakistan's Snow map

Gilgit Baltistan= 100%
FATA= 80-85%
KPK= 65-70%
AJK= 55-60%
Balochistan= 15-18%
Punjab= 1% ( Murree & Patriata , Soon Sakesar Valley )

Margalla hills in Islamabad and Kirthar mountain ranges in Sindh occasionally receives snowfall.

JGr9ccI.jpg


.........................................................................................................


Languages of Pakistan

QcV8vU7.jpg
 
Weekly inflation falls by 0.12% for combined income group

ISLAMABAD: The weekly inflation rate for the week ended on January 5 for the combined income group declined by 0.12 % compared to the previous week.

According to the data released by the Pakistan Bureau of Statistics (PBS) on Friday, the Sensitive Price Indicator (SPI) for the week under review in the aforementioned group was at 217.84 points vs 218.45 points for the previous last week. As compared to the same week last year, the SPI for the combined group in the week under review witnessed a decrease of 0.13 percent.

The weekly SPI has been computed with base of 2007-2008=100, covering 17 urban centres and 53 essential items for all income groups combined.

Meanwhile, the SPI for the lowest income group up to Rs 8,000 decreased by 0.11 percent as it went down 208.93 points in the previous week to 208.70 points in the week under review. As compared to the last week, the SPI for the income groups from Rs 8,001 to Rs 12,000, Rs 12,001 to 18,000, Rs 18,001 to 35,000 and above Rs 35,000 also decreased by 0.12 percent, 0.13 percent, 0.13 percent and 0.12 percent, respectively.

During the week under review, average prices of nine items registered decrease, while 16 items increased with the remaining 28 items' prices unchanged. The items, which decrease in prices during the week under review, include tomatoes, potatoes, chicken, pulses, onions, garlic and red chilly.

The items, which increased on average were include sugar, eggs, bananas, LPG cylinder, jaggery, salt (powdered), rice (iir-6), cigarettes, mutton, wheat, vegetable, vegetable ghee, gram pulse, wheat flour and cooking oil. The items with no change in their average prices during the week under review include bread (plain), beef with bone, milk, curd, milk (powder), mustard oil, tea (packet), cooked beef, tea (prepared), long cloth, shirting, georgette, men's sandal, men's shoes, ladies sandal, electricity charges, gas charges, kerosene oil, firewood, electric bulb, washing soap, match box, petrol, diesel, telephone local call and bath soap.
 
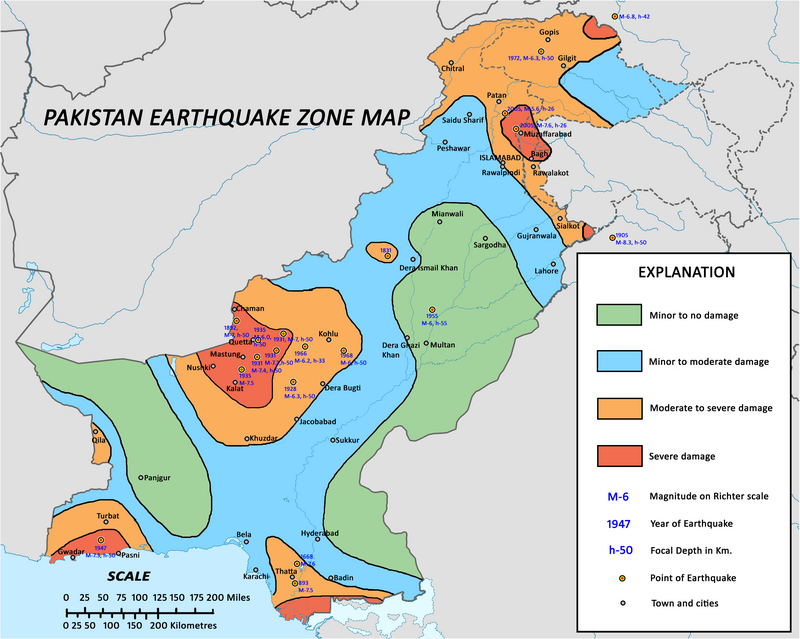
The official image of seismic zones in Pakistan is the following one:


hazard1.jpg


db62b1e1fbf3a98d5abf56a0fdd25a76.jpeg
 
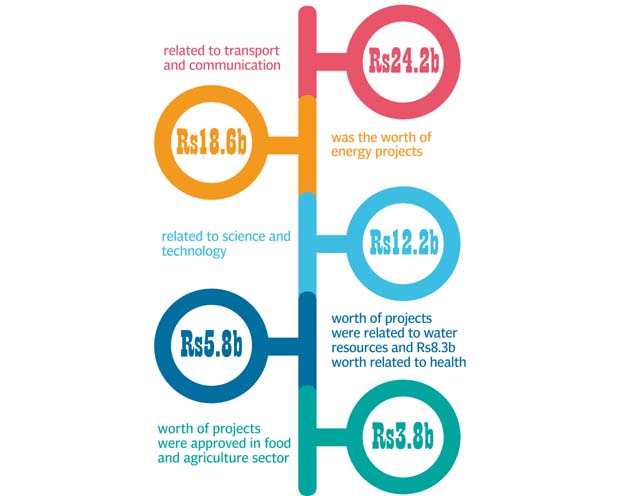
The first-quarter spending was Rs69 billion less than planning ministry’s authorisation and Rs100 billion below the quarterly ceiling. A significant chunk of Rs100.5 billion was given for parliamentarian’s schemes.


9-1512415843.jpg
 
Karachi doesn't get many earthquakes but in the future it will be hit by a massive earthquake. That's inevitable. But Karachi lies in a low damage area.

The last time a major earthquake hit near Karachi was in 1819 in Allahbund, Sindh...it was 7.7. In 1618 a 7.6 earthquake hit Shahbandar, Sindh...killed over 50,000 people according to historical records.

Sindh us due for another major Earthquake if we're going by previous trends.

1618
1819
2018/2019/2020?

800px-Sesimic_hazard_zones_of-Pakistan.png
 
Pakistan Council of Research in Water Resources is working with United States' National Air and Space Administration (NASA) to monitor groundwater resources in the country.


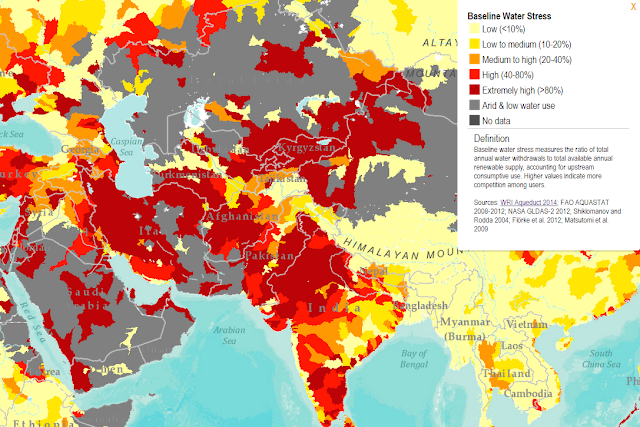
Water Stress Satellite Map Source: NASA


NASA's water stress maps shows extreme water stress across most of Pakistan and northern, western and southern parts of India.
 
Education and Literacy Rates:

Pakistan's net primary enrollment rose from 42% in 2001-2002 to 57% in 2008-9. It has been essentially flat at 57% since 2009 under PPP and PML(N) governments.


Source: Economic Survey of Pakistan 2015-16

Similarly, the literacy rate for Pakistan 10 years or older rose from 45% in 2001-2002 to 56% in 2007-2008 during Musharraf years. It has increased just 4% to 60% since 2009-2010 under PPP and PML(N) governments.


Source: Economic Survey of Pakistan 2015-16

Pakistan's Human Development:

Human development index reports on Pakistan released by UNDP confirm the ESP 2015 human development trends.Pakistan’s HDI value for 2013 is 0.537— which is in the low human development category—positioning the country at 146 out of 187 countries and territories. Between 1980 and 2013, Pakistan’s HDI value increased from 0.356 to 0.537, an increase of 50.7 percent or an average annual increase of about 1.25.


Pakistan HDI Components Trend 1980-2013 Source: Human Development Report 2014


Overall, Pakistan's human development score rose by 18.9% during Musharraf years and increased just 3.4% under elected leadership since 2008. The news on the human development front got even worse in the last three years, with HDI growth slowing down as low as 0.59% — a paltry average annual increase of under 0.20 per cent.
 
Pakistan Per Capita Cement Consumption Hit New High of 170 Kg in 2016

Pakistan's domestic cement consumption reached 35 million tons in 2016, up from 30 million tons in 2015, according to a report published by Global Cement. Using the latest census population of 207 million, it works out to about 170 Kg per person consumption. The increase is driven by a combination of CPEC-related infrastructure projects as well as commercial and housing construction.


Pakistan Cement Sales. Source: Global Cement

While domestic demand for cement is continuing its upward trend, the exports have suffered a major decline. In 2009, the exports hit a high of over 11 million tons, constituting 34% of all cement dispatches at the time. Since then, they have fallen to below 6 million tons or 14% of all sales.

Pakistan cement industry is booming. There is some disagreement about where the biggest demand is coming from. The CEO of Thatta Cement says it is 60% infrastructure and 40% housing but others say it is 70% housing and 30% infrastructure.

Pakistan's 11 cement manufacturers are investing a combined $2.25 billion to add new production capacity of 30 million tons a year by 2019, according to the State Bank of Pakistan.

The year 2017 is also proving to be yet another boom year for cement industry. Cement sales have soared by 15% year-on-year to 10.3 million tons in the first quarter of fiscal year 2017-18 that ended in September 2017, up from 9 million tons in the same period in 2016.

Pakistan is among the world’s fastest-growing construction markets. A BMI report published earlier in 2017 forecasts an average 12 percent growth annually for the next five years. Cement capacity utilization increased to 88 percent in the 10 months through April, the highest in 11 years, according to Bloomberg.

Beyond the construction industry boom, Pakistan's LSI is also soaring by double digits. Both of these sectors are important drivers for job growth in the country.

Although production was driven mostly by strong domestic demand, the exports in July-Sept 2018 also increased nearly 11% over the same period last year.

Among the notable sub-sectors driving strong LSM growth in July-August 2017 are: Tractors 115%, motorcycles 28.3%, deep freezers 16.2%, air-conditioners 26.8%, electric-fans 22.4%, electric motors 17.3% and electric meters 18.3%, and switchgear 20.8%.

Significant improvement in the country's security situation is helping restore confidence of investors, businesses and consumers who are pushing economic growth in Pakistan to new highs. The fast pace of execution of China-Pakistan Economic Corridor is at least partly responsible for it.
 

Latest posts

Back
Top Bottom