Metal 0-1
FULL MEMBER

- Joined
- Aug 14, 2016
- Messages
- 1,996
- Reaction score
- 12
- Country

- Location
Introduction
J-20 is the world’s third operational fifth-generation stealth fighter aircraft after the F-22 and F-35. It made China the second country in the world after the USA to operate a fleet of stealth fighter. By the time this article is published, it is estimate that there are around 208 J-20 produced.
Goals of the simulation:
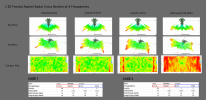
The aim of our simulation is to evaluate the mean and median radar cross section as well as the radar scattering pattern of the J-20 at 4 frequencies:- VHF – 150 MHz
- L Band – 1150 MHz
- S Band – 3150 MHz
- X Band – 8150 MHz
- Case 1 simulates situation when the stealth aircraft have to face multiple radars located far from each others, thus they can illuminate the fighter from directions where the strong reflection lobes located
- Case 2 simulates situation when aircraft face small number of radars located close together so the stealth fighter can turn its nose toward targets

Note: The contour map results for Case 2 is actually a part of Case 1 contour map, but it will be shown separately so that viewer can have an easier time visualize the radar lobes arrangement and how direction affect stealth fighter RCS.
Explanation of some terms:
Median RCS is the middle RCS value of all RCS data. Which mean 50% of RCS spike inside the arcs will be higher than the median value, and the others 50% of RCS spike inside the arcs will be smaller than the median valueMean RCS is the average of all RCS data.
It is very important to remember that both Median and Mean RCS does not tell the whole story, two object with the same Median and Mean RCS does not necessary equally visible to radar when viewed from the same direction ,thus we also need the contour map to see the arrangement of the reflection lobes.
RCS value illustrated inside the contour map will be measured in dBsm. To convert RCS between dBsm and m2, we can use the following guidance.
CONVERTING RADAR CROSS SECTION IN SQUARE METERS TO DECIBELS
dBsm = 10 x log10(RCS/1m2)
CONVERTING RADAR CROSS SECTION IN DECIBELS TO SQUARE METERS
RCS = 10(Decibels/10)
Basics Rules:
Because not every information about J-20 is available in the public sectors, we will follow several rules in the simulation.- In real life, J-20 skin has a layer of radar absorbing material (RAM) to absorbing radar energy. However, in this simulation, all external surface including the canopy will be treated as perfect electrical conductor (meaning they will reflect radio wave like metal)
- Stealth fighter will have trailing edge and leading edge treatment on its wings, horizontal and vertical stabilizers as well as inlet lips to reduce the magnitude of radar return from edge scattering and creeping wave return effect. But those effect were not added in our previous simulation for F-35 and Su-57 because there wasn’t enough information about their leading and trailing edge treatment. However, this time, the trailing edge treatment on the canard and main wing of J-20 in the form of edge serration will be simulated because they are very easily to identify visually
- J-20 radome is a FSS radome, so it will be treated as perfect electrical conductor for all frequencies except the bandpass frequency
- Luneburg lens which often used to increase stealth aircraft’s RCS will not be included in this simulation
- All cooling vents will be modeled
- The inlet , the radar blocker and the first 2 fan stages of 2 × WS-10C engine will be modeled
- Even though there is no current data on the absorbing capability of the RAM used by J-20. The inner surface of the inlet duct from the start of DSI bump leading to the engine stages and the radar blocker will be coated with a layer of MnZn ferrite RAM. This rule is made due to the fact that it is not possible to evaluate the RCS reduction effect of S-duct inlet without a layer of RAM added. The absorbing capability of the MnZn RAM will be based on actual real world measurement data. The current absorbing capability of the RAM used in our simulation is around -8 dB at 8.15 GHz and -4 dBsm at 3.15 GHz. Keep in mind though that actual RAM used on stealth aircraft may have absorbing rating of -15 to -25 dB depend on the actual frequency.

Software used:
- Model of the J-20 is created using SolidWorks software, the model of the Infrared pod (Chinese EOTS) is created by Autodesk FBX. They are then converted to the same format to be added together.
- In most studies, radar scattering simulations are often done using POFACETS because it can run on most commercially available computer and provides convenient run–times. Unfortunately because POFACETS only rely on Physical Optics method to predict the RCS of target. As a result, it cannot take into account phenomena such as creeping waves return, thus lead to underestimation of target RCS value. Hence this radar scattering simulation will be done using Ansys HFSS. HFSS allows edge scattering, creeping wave, cavity return to be simulated accurately, thus it will be our chosen software.
OUTSIDE:
Top view

Side view

Bottom View

Head on view

Tail on view

SMALL PARTS AND REFERENCE IMAGES
EOTS window and pitot tube


Canard root hump and antenna hump


Wing actuator humps and small humps near ventral fins


Humps on LERX, and belly DAS sensor


Attachments
Last edited:

 , hope pak will get these birds after china getting its hands on 6th generation aircraft