Soumitra
ELITE MEMBER

- Joined
- Jan 11, 2011
- Messages
- 8,415
- Reaction score
- -17
- Country

- Location
Just strategists and experts started believing that India may have flattened the Wuhan Corornavirus curve with the strict 21-day nationwide lockdown, the Tablighi Jamaat super spreader caused a Coronavirus explosion in India and pushed back our efforts in fighting the pandemic.
Over 95% of the coronavirus cases reported over the last two days in India have been found to have links with the Tablighi Jamaat congregation in Delhi. However, due to the relentless efforts of the government to contact trace and quarantine effectively, India’s coronavirus spread curve flattened again yesterday, giving rise to the hope that if we could maintain this, India might be back on track soon.
Economist Shamika Ravi, who is currently the Director of Research at Brookings India and former member, PM’s Economic Advisory Council, in a series of Tweets today shared some graphical representation of statistical data showing a welcome turn in the Coronavirus growth rate in India where the curve seems to have flattened. She believes that even though it is a little too early to comment, but, if this trend continues, it will soon bring some relief for India.
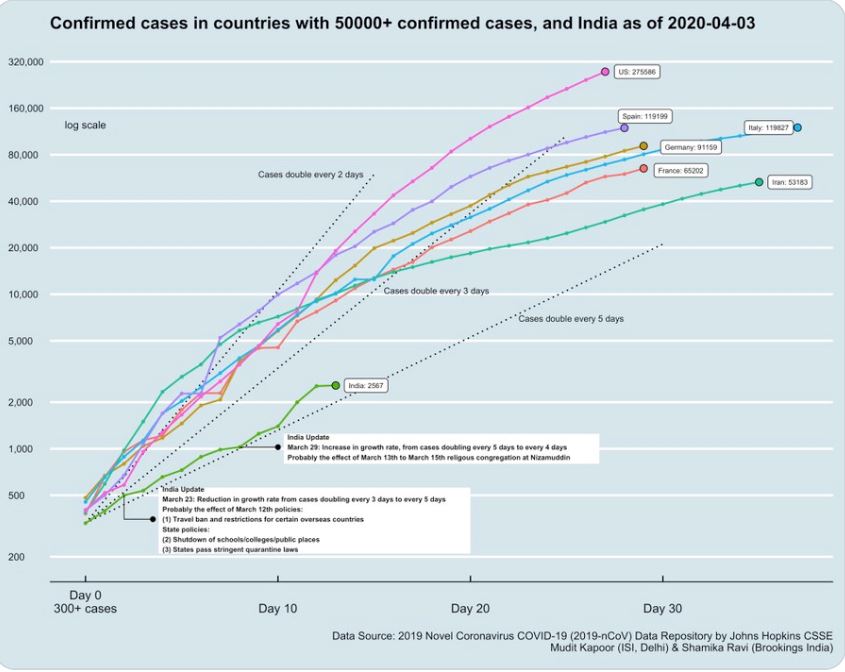
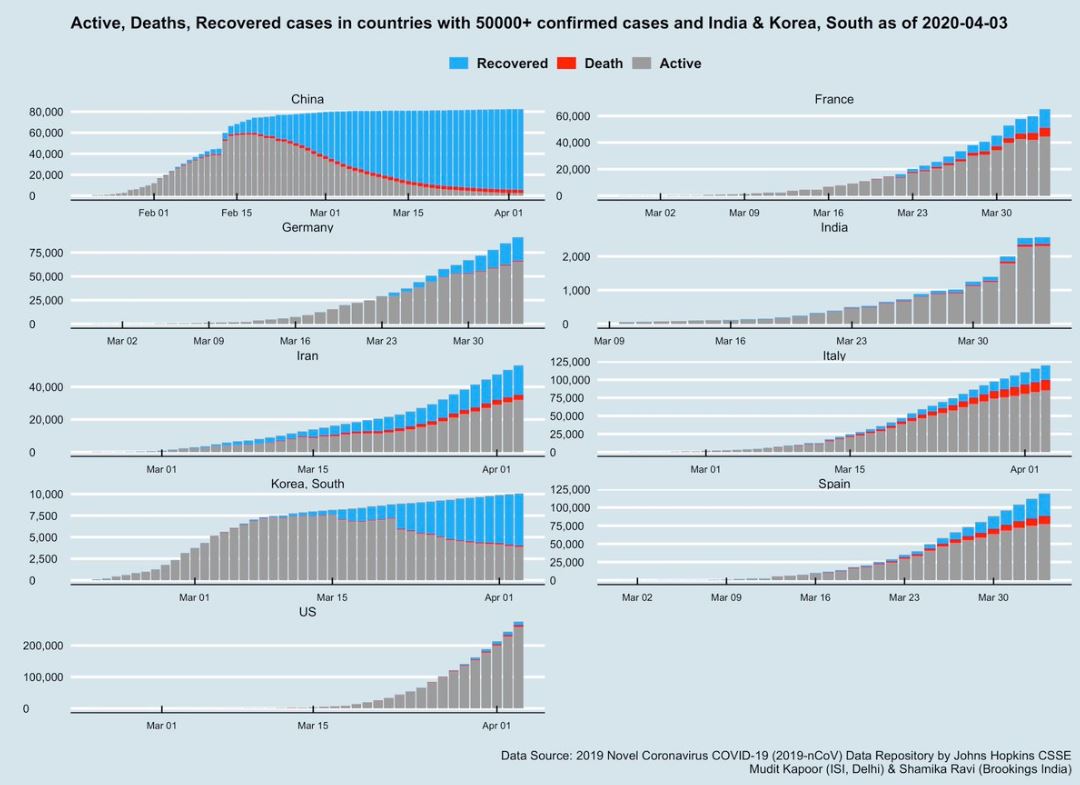
The first graph she shares shows the countries with 50,000+ confirmed cases and India as on April 4, 2020. The graph shows the countries where the confirmed Coronavirus cases have doubled in two, three and five days.
Compared to countries like the US and Spain which have regularly seen cases doubling every 2 days as well as 3 days, as on March 23 India saw a reduction in growth rate from cases doubling every 3 days to 5 days.
The economist credits this to the restrictions imposed by various states and the centre as on March 12, namely:

Graph depicting the Coronavirus spread in India shared by Shamika Ravi
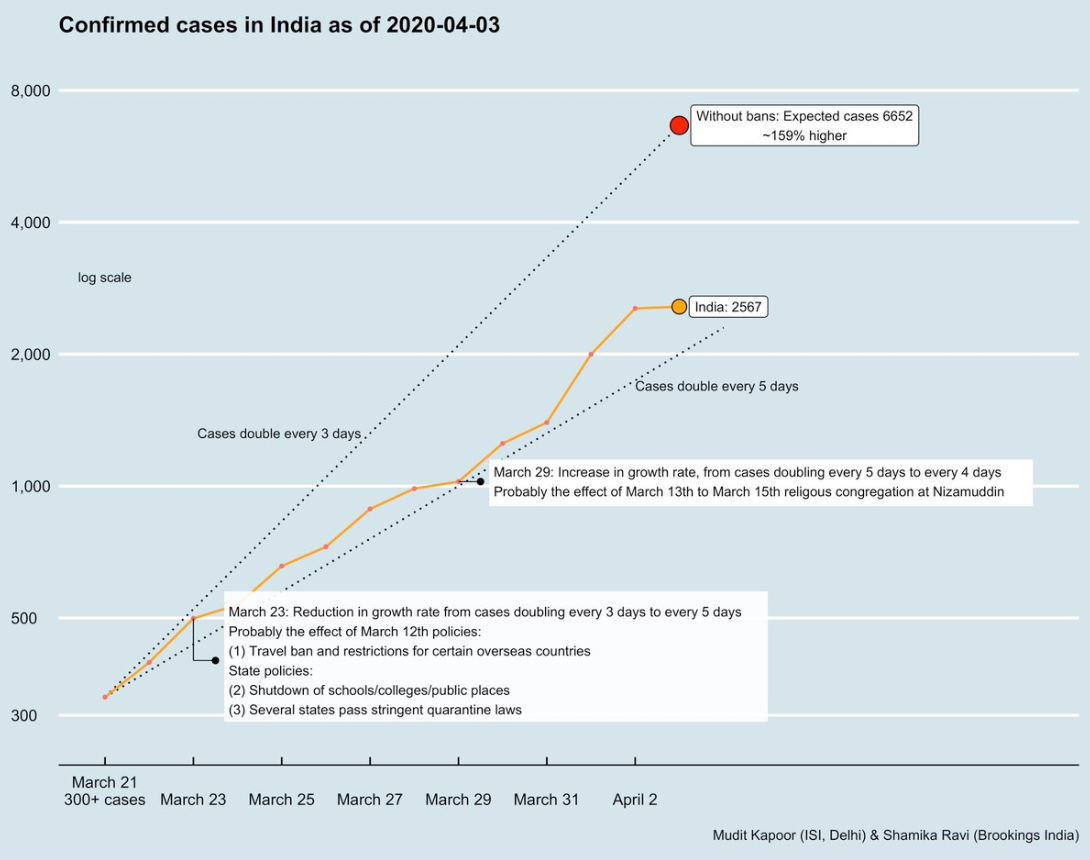
In the second tweet, Ravi shares two graphs, In the first graph the orange line represents the total number of confirmed cases in India from March 21 to April 4. As we can see in the graph India saw a sudden surge in cases from March 31 to April 2, the sudden spike is probably due to the Tablighi Jamaat cases, however, the graphical representation shows that after April 2 until April 4 the yellow line is flat. This means that according to the last two days statistics the growth curve has flattened for India. This can again, safely be attributed to the exemplary efforts of the government who are successfully contact tracing and then promptly isolating those tracked.

Graph depicting the Coronavirus spread in India shared by Shamika Ravi
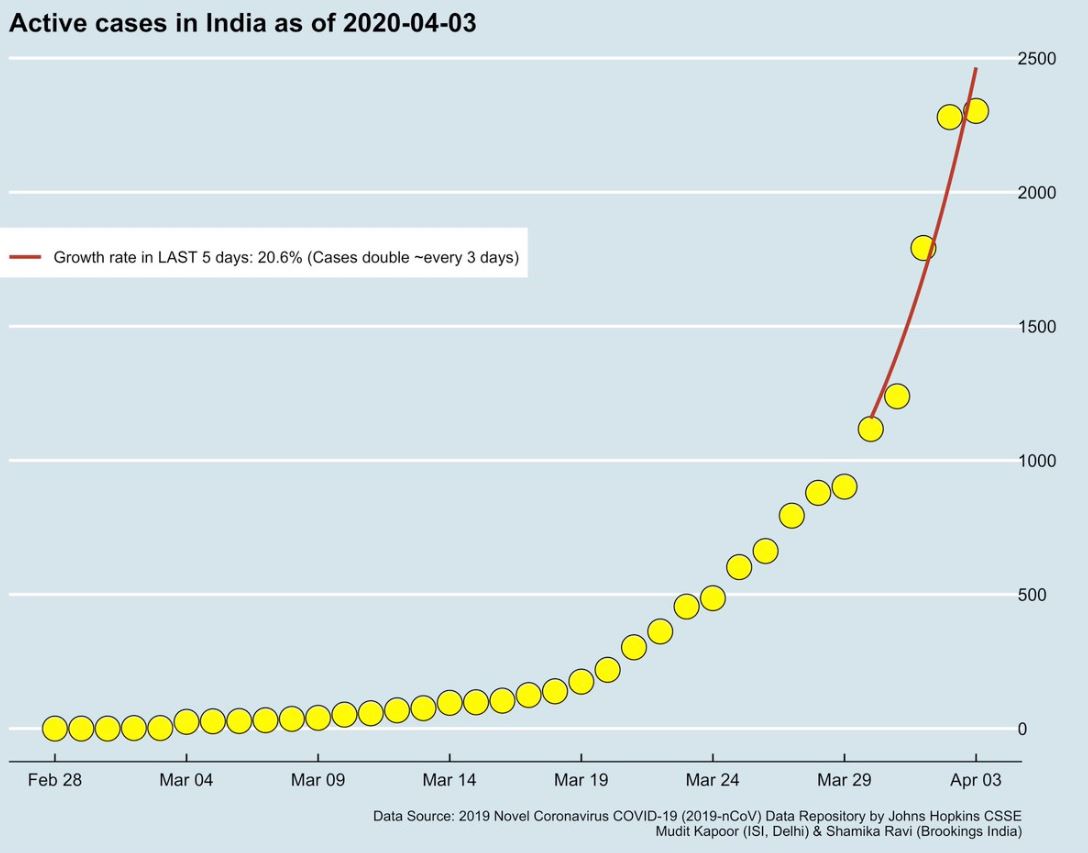
The second graph displays how the active cases in the last five day in India have grown by 20.6%

Graph depicting the Coronavirus spread in India shared by Shamika Ravi
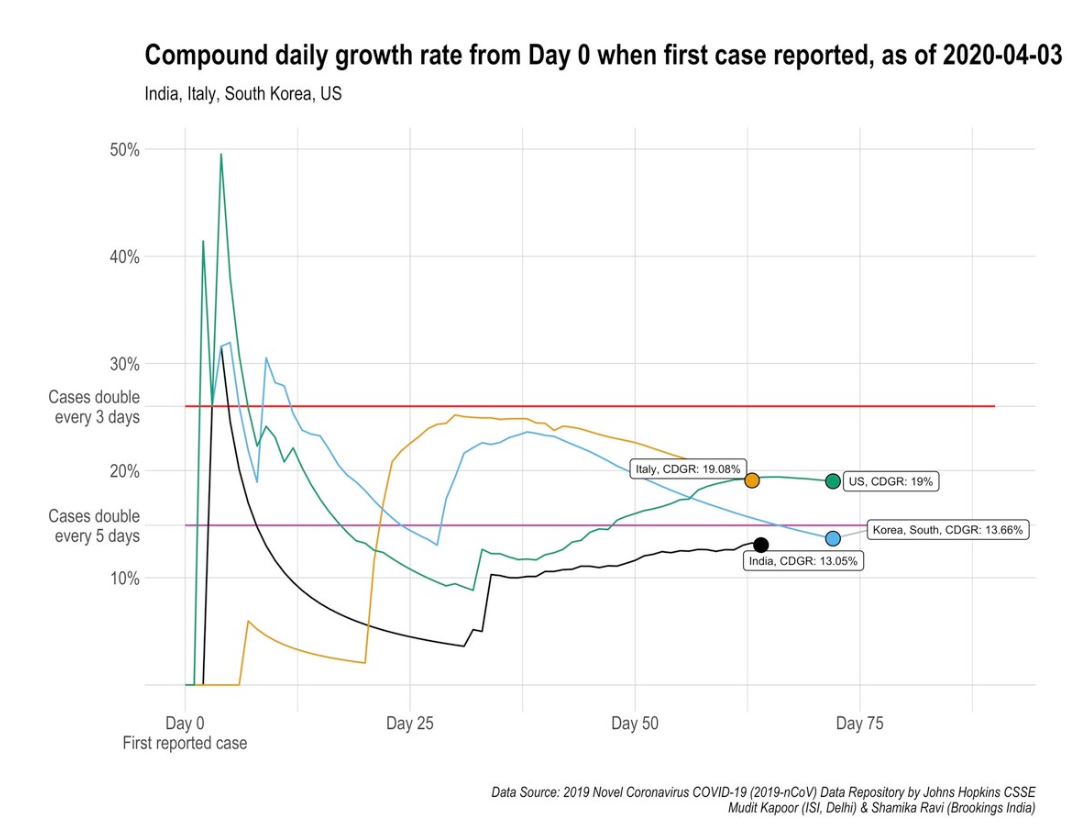
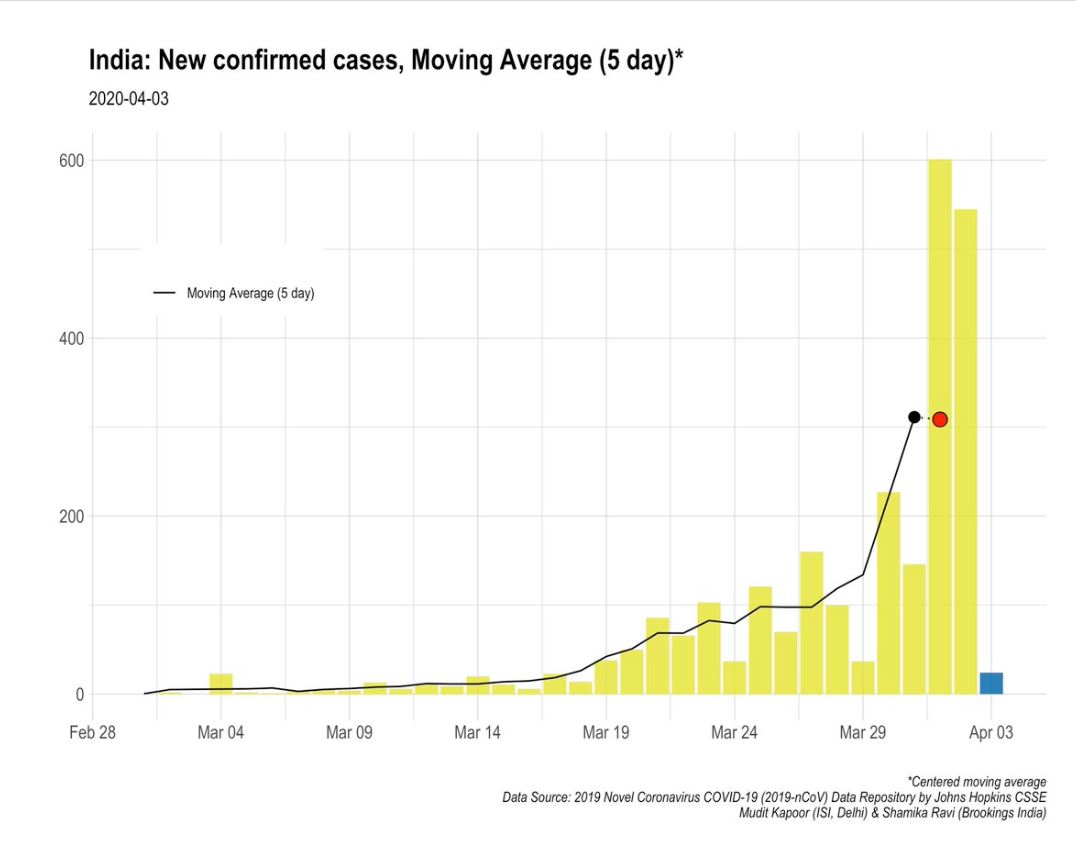
In the next tweet, the economists again by the means to two graphical representation depicts that the Compound daily growth rate of confirmed cases in India has steadied at 13.05%. She confirms that they have “introduced a new statistic for improved understanding of #Covid19India trends – 5day moving average of new confirmed cases – and it shows a welcome flattening”.
The first graph represents the compound daily growth rate from day 0, when the first case was reported, as of April 4, 2020. And the second graph is a reprsentaion of the 5-day moving average of new confirmed cases in India.

Graph 1

Graph 2
In the subsequent tweet, Ravi shows the total Chinese Coronavirus related deaths across major hotspot countries, and in India. According to the graph, amongst all the select countries, the mortality rate per million as on April 4 is the lowest in India.

Graph depicting the Coronavirus spread in India shared by Shamika Ravi
In her last tweet, Ravi graphically breaks up the total confirmed cases into 3 categories:

Graph depicting the Coronavirus spread in India shared by Shamika Ravi
If we are to believe these statistics, India’s Coronavirus spread curve has flattened again in the last two days, leading us to hope that the 2-day spike was largely because of the Tablighi Jamaat super spreader effect.
As per the ministry of health and family welfare statistics, the 647 Coronavirus cases reported over the last two days have been linked to the Tablighi Jamaat. The ministry data shows the two-day increase as 664 in India – 328 on Thursday and 336 on Friday.
“There has been an increase in cases over the last two days. Though COVID-19 positive cases were being reported, the surge has happened only over the last two days. This shows that one mistake can have repercussions and can put us back our efforts in fighting such a pandemic,” said Joint Secretary (Health) Lav Agarwal.
Tablighi Jamaat links have been found in cases across 14 states including Andaman and Nicobar, Assam, Delhi, Himachal Pradesh, Haryana, Jammu and Kashmir, Jharkhand, Karnataka, Maharashtra, Rajasthan, Tamil Nadu, Telangana, Uttar Pradesh and Uttarakhand.
The religious congregation has also put Maharashtra at the top of the statewise active Coronavirus cases, pushing behind Tamil Nadu. The state-wise ministry data as on April 4 had Maharashtra with 423 active cases and Tamil Nadu with 411.
The official data according to the ministry’s official website at on Saturday put the total number of cases in India at 2902 and 68 deaths.
https://www.opindia.com/2020/04/ind...curve-flatten-despite-tablighi-jamaat-graphs/
Over 95% of the coronavirus cases reported over the last two days in India have been found to have links with the Tablighi Jamaat congregation in Delhi. However, due to the relentless efforts of the government to contact trace and quarantine effectively, India’s coronavirus spread curve flattened again yesterday, giving rise to the hope that if we could maintain this, India might be back on track soon.
Economist Shamika Ravi, who is currently the Director of Research at Brookings India and former member, PM’s Economic Advisory Council, in a series of Tweets today shared some graphical representation of statistical data showing a welcome turn in the Coronavirus growth rate in India where the curve seems to have flattened. She believes that even though it is a little too early to comment, but, if this trend continues, it will soon bring some relief for India.
The first graph she shares shows the countries with 50,000+ confirmed cases and India as on April 4, 2020. The graph shows the countries where the confirmed Coronavirus cases have doubled in two, three and five days.
Compared to countries like the US and Spain which have regularly seen cases doubling every 2 days as well as 3 days, as on March 23 India saw a reduction in growth rate from cases doubling every 3 days to 5 days.
The economist credits this to the restrictions imposed by various states and the centre as on March 12, namely:
- Travel ban and restrictions for certain oversees countries imposed by the central government.
- State-imposed shut down of school, colleges and public places.
- States passed stringent quarantine laws
Graph depicting the Coronavirus spread in India shared by Shamika Ravi
In the second tweet, Ravi shares two graphs, In the first graph the orange line represents the total number of confirmed cases in India from March 21 to April 4. As we can see in the graph India saw a sudden surge in cases from March 31 to April 2, the sudden spike is probably due to the Tablighi Jamaat cases, however, the graphical representation shows that after April 2 until April 4 the yellow line is flat. This means that according to the last two days statistics the growth curve has flattened for India. This can again, safely be attributed to the exemplary efforts of the government who are successfully contact tracing and then promptly isolating those tracked.
Graph depicting the Coronavirus spread in India shared by Shamika Ravi
The second graph displays how the active cases in the last five day in India have grown by 20.6%
Graph depicting the Coronavirus spread in India shared by Shamika Ravi
In the next tweet, the economists again by the means to two graphical representation depicts that the Compound daily growth rate of confirmed cases in India has steadied at 13.05%. She confirms that they have “introduced a new statistic for improved understanding of #Covid19India trends – 5day moving average of new confirmed cases – and it shows a welcome flattening”.
The first graph represents the compound daily growth rate from day 0, when the first case was reported, as of April 4, 2020. And the second graph is a reprsentaion of the 5-day moving average of new confirmed cases in India.
Graph 1
Graph 2
In the subsequent tweet, Ravi shows the total Chinese Coronavirus related deaths across major hotspot countries, and in India. According to the graph, amongst all the select countries, the mortality rate per million as on April 4 is the lowest in India.
Graph depicting the Coronavirus spread in India shared by Shamika Ravi
In her last tweet, Ravi graphically breaks up the total confirmed cases into 3 categories:
- Total number of active cases as on April 4
- Total number of recovered cases as on April 4
- Total number of deaths as on April 4
Graph depicting the Coronavirus spread in India shared by Shamika Ravi
If we are to believe these statistics, India’s Coronavirus spread curve has flattened again in the last two days, leading us to hope that the 2-day spike was largely because of the Tablighi Jamaat super spreader effect.
As per the ministry of health and family welfare statistics, the 647 Coronavirus cases reported over the last two days have been linked to the Tablighi Jamaat. The ministry data shows the two-day increase as 664 in India – 328 on Thursday and 336 on Friday.
“There has been an increase in cases over the last two days. Though COVID-19 positive cases were being reported, the surge has happened only over the last two days. This shows that one mistake can have repercussions and can put us back our efforts in fighting such a pandemic,” said Joint Secretary (Health) Lav Agarwal.
Tablighi Jamaat links have been found in cases across 14 states including Andaman and Nicobar, Assam, Delhi, Himachal Pradesh, Haryana, Jammu and Kashmir, Jharkhand, Karnataka, Maharashtra, Rajasthan, Tamil Nadu, Telangana, Uttar Pradesh and Uttarakhand.
The religious congregation has also put Maharashtra at the top of the statewise active Coronavirus cases, pushing behind Tamil Nadu. The state-wise ministry data as on April 4 had Maharashtra with 423 active cases and Tamil Nadu with 411.
The official data according to the ministry’s official website at on Saturday put the total number of cases in India at 2902 and 68 deaths.
https://www.opindia.com/2020/04/ind...curve-flatten-despite-tablighi-jamaat-graphs/


