Echo_419
ELITE MEMBER

- Joined
- Sep 12, 2012
- Messages
- 13,111
- Reaction score
- -4
- Country

- Location

Communal govt attacking poor MPs
Follow along with the video below to see how to install our site as a web app on your home screen.
Note: This feature may not be available in some browsers.


After reading through this I can only find 4 things that make sense.A Peek at India’s New GDP Numbers - India Real Time - WSJ
Still confused about those sizzling new economic-growth figures coming out of India? You’re not alone.
The country’s Central Statistical Office invited analysts and economists to a daylong workshop in New Delhi this week, hoping to explain and clarify the recent revisions to its methodology for estimating gross domestic product.
Those revisions suddenly caused India’s projected growth rate to shoot past China’s, which in turn thrust the nuts and bolts of India’s GDP calculation into the spotlight. Officials were pelted with questions as they walked through the new data sources, the updated surveys, the tweaked methods of extrapolating and scaling and counting.
Much of the information about the new GDP method had already been made public in a144-page document released last month. But who has the time? Here are some highlights.
1. In India, all cars used to be equal. In earlier Indian GDP data, the key manufacturing indicator was the monthly index of industrial production, which is based on the total quantity of output in a sample of a few thousand factories.
“The problem is that Marutis and Audis are all put together as the same,” said Ashish Kumar, director-general of the Central Statistical Office. In other words, by gauging only the volume of production, the old series was overlooking changes in monetary value brought about by product improvement and differentiation.
In the old GDP series, a yearly survey of industrial firms supplemented the production index when it became available. But that survey, too, has a limitation: Because it measures activity at the factory level, it doesn’t account for the marketing, development, logistics and financial-planning activities that take place at manufacturing firms’ head offices.
“In the earlier series, we were not capturing this,” Mr. Kumar said. “Because we never had access to any such information.”
The new GDP series therefore incorporates a new database of company balance sheets from the Ministry of Corporate Affairs. For the year ended March 2012, the database includes information from more than 500,000 firms. A central-bank study that had been used previously to gauge corporate activity covered fewer than 2,500 companies.
The impact on final growth rates is huge—and still slightly hard to swallow. In the 12 months that ended March 2013, manufacturing expanded 6.2% in the new GDP series, compared with 1.1% in the old. And in the following year, for which the old series had shown a 0.7% contraction, the new series has manufacturing growing by 5.3%.
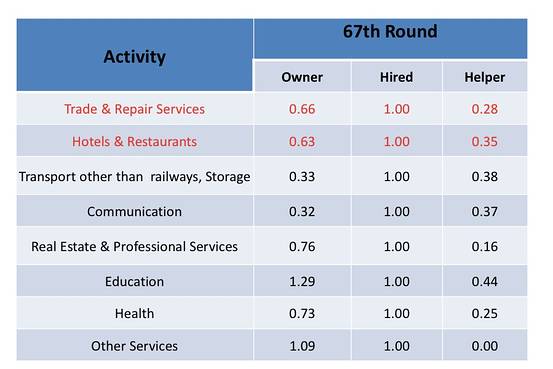
2. All workers used to be equal, too. Well, at least for gauging activity in the informal economy. Small, unregistered companies—a major chunk of the Indian economy—typically employ unpaid helpers in addition to owners and hired workers. But before, these firms’ output was being estimated by taking the total number of workers and multiplying by per-capita added value.
No longer. The new GDP series uses an “effective labor input” method, which assigns different weights to different kinds of workers based on their productivity. The chart is here:
Central Statistical Office
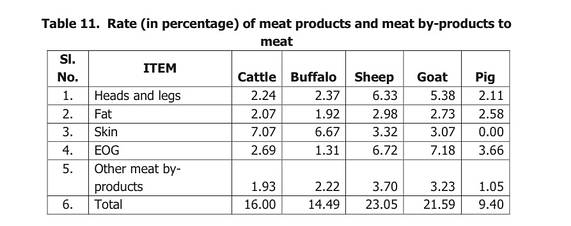
3. Agriculture isn’t just about crops, and livestock isn’t just about meat. Two major changes in the agricultural component of the new GDP series have to do with livestock. The first is a new way of valuing “meat byproducts.” State governments had been failing to provide direct data on the values and quantities of animals’ heads, legs, fat and skin on a “systematic and regular basis.” So, thanks to a study by the National Research Center on Meat, in Hyderabad, these are now being recorded simply as a share of the total value of the animals’ flesh.
Here’s the chart:
Central Statistical Office
Yum. “EOG” stands for “edible offals and glands.”
The second major change to livestock measurement has to do with a different kind of byproduct. “For the first time, we have included the evacuation rate of goats and sheep in the production of organic manure,” said Sunil Jain, a deputy director-general at the statistics office.
Translation: Using a study on how much those animals defecate, statisticians have added that particular kind of biological output to their economic value.
The estimated “evacuation rates” are 0.3 kilograms per day for goats and 0.8 kilograms per day for sheep. The study, titled “Positive Environmental Externalities of Livestock in Mixed Farming Systems of India,” was conducted jointly by the Central Institute for Research on Goats, in Makhdoom, Uttar Pradesh, and the National Center for Agricultural Economics and Policy Research in New Delhi.
With all those “droplets” added in, the value of India’s livestock sector in the new GDP series is 9.1 billion rupees, or $150 million, higher than it was in the old series.
Why did the Central Statistical Office choose to start counting droplets? “It is based upon the observation of the farmers that, ‘OK, if I have to increase the fertility of my soil, I would request a shepherd to leave many animals in my field for a week,’ ” Mr. Jain said.
4. Finance is still a pretty new industry in India. Or at least measuring the financial industry is pretty new.
In the previous GDP series, the industry had two main components: banking, which made up 80.1% of added value in the sector, and insurance, which made up the rest. In fact, in the official guide to the old GDP figures, the financial industry was called just that: “Banking and Insurance.”
By contrast, the new GDP series includes separate measurements of stock exchanges and stock brokers. It counts the growing plethora of private investment funds available to Indians. In the old GDP figures, UTI, the formerly government-managed investment vehicle, had been the sole mutual or money-market fund being measured. The Employees’ Provident Fund Organization, the state-run social-security program, was the only pension fund.
Not even informal finance, hardly a recent scourge in poorer corners of India, was being estimated separately before the latest GDP series. It was just assumed to be one-third the size of the formal, non-bank financial industry. Now, private moneylenders’ contribution to the economy is measured using survey data from the central bank.
5. Hoarding gold is now officially virtuous. In the new GDP series, households’ expenditure on gold and silver ornaments is treated as part of their savings instead of their consumption. The value of such savings, in the year ended March 2012, was recorded at 340 billion rupees, or $5.4 billion—which, despite Indians’ infamous appetite for gold, represented only 1% of total savings in the economy that year.
6. When it comes to timely economic data, India is still far, far behind rich countries. The biggest obstacle to measuring the Indian economy is how much of it is informal: cash-based, outside the tax net and leaving no paper trail. Two-thirds of India’s nonfarm workforce are employed this way.
With measurements on such a large portion of the economy available only via surveys conducted once every five years—less often in some cases—Indian statisticians invariably rely on various workarounds to produce yearly GDP numbers. For the informal economy, the new series uses tax and corporate data instead of blunter indexes of production to project survey findings forward.
That’s ostensibly an improvement. But India’s data deficiencies don’t end there.
In rich countries, GDP can be triangulated: Whether you tally up the value of what’s produced, the money that is spent to buy that production or the income earned from selling it, the total should be the same. Not so in India, where only production data are considered reliable.
Data on securities and other financial instruments are underdeveloped as well. India doesn’t have regular statistics on employment.
“There’s a large number of areas where we have deviated” from the United Nations’ latest guidebook on measuring GDP, said T.C.A. Anant, who holds the title of chief statistician of India—“for a large measure, because we are simply, at the moment, unable to implement those recommendations.”