What's new

Comparing Median Income & Wealth Data For India & Pakistan

RiazHaq

SENIOR MEMBER
Joined
Oct 31, 2009
Messages
6,611
Reaction score
70
Country
Pakistan
Location
United States
http://www.riazhaq.com/2017/01/comparing-median-income-wealth-data-for.html


Top 1% of Indians own 58% of wealth in India, according to a recent report by Oxfam as published by Wall Street Journal. The report said the global average for wealth ownership of the top 1% is 51%.
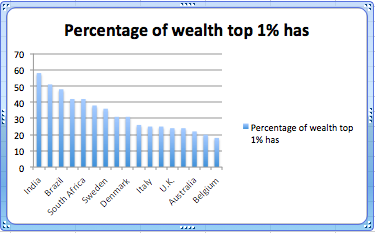


Source: Oxfam


The income and wealth concentration in the hands of the richest top 1% skews the average per capita incomes and makes the material well-being of average citizen look better than it is. The best way to measure how well or poorly an average citizen is doing is to look at the median income and wealth, not the average or mean.

Median Incomes in South Asia:

Centre for Global Development has estimated 2014 median incomes of countries around the world. Here's what it reported for India and Pakistan:

Pakistan: Median Income per capita: $1204.50, Median Household Income: $6,022.50 Mean (Average) per capita $4,811.31

India Rural: Median per capita $930.75 Median Household $4,653.75 Mean (Average) per capita $5,700.72

India Urban: Median per capita $1295.75 Median Household $6,478.75 Mean(Average) per capita: $5,700.72

It shows that India's urban median income is slightly higher than Pakistan's median income. However, India's rural median income is significantly lower than Pakistan's. It should be noted that 70% of India's population lives in rural areas, much higher than Pakistan's 61%, according to the World Bank.

Median Wealth in South Asia:

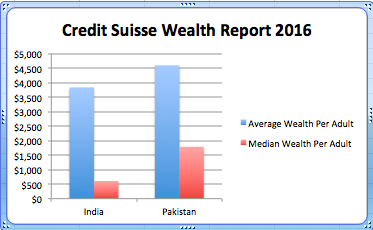
Average Pakistani adult is 20% richer than an average Indian adult and the median wealth of a Pakistani adult is 120% higher than that of his or her Indian counterpart, according to Credit Suisse Wealth Report 2016. Average household wealth in Pakistan has grown 2.1% while it has declined 0.8% in India since the end of last year.


Source: Credit Suisse Wealth Report 2016

Here are the key statistics reported by Credit Suisse:

Total Household Wealth Mid-2016 :

India $3,099 billion Pakistan $524 billion

Wealth per adult:

India Year End 2000 Average $2,036 Median $498.00

Pakistan Year End 2000 Average $2,399 Median $1,025

India Mid-2016 Average $3,835 Median $608

Pakistan Mid-2016 Average $4,595 Median $1,788

Average wealth per adult in Pakistan is $760 more than in India or about 20% higher.

Median wealth per adult in Pakistan is $1,180 more than in India or about 120% higher

Summary:

The income and wealth concentration in the hands of the richest top 1% skews the average per capita incomes and makes the material well-being of average citizen look better than it is. The best way to measure how well or poorly an average citizen is doing is to look at the median income and wealth, not the average or mean. Median income and wealth figures in South Asia show that average Pakistanis are better off economically than their counterparts in India.

Related Links:

Haq's Musings

Credit Suisse Global Wealth Report 2016

Pakistan's Middle Class Larger and Richer Than India's

Pakistan Translates GDP Growth to Citizens' Well-being

Rising Motorcycle Sales in Pakistan

Depth of Deprivation in India

Chicken vs Daal in Pakistan

China Pakistan Economic Corridor


ADB Raises Pakistan GDP Growth Forecast


http://www.riazhaq.com/2017/01/comparing-median-income-wealth-data-for.html
 
Oh look its this regurgitated topic again....

Already asked and answered (regarding the flaws). Let me just post my replies in that discussion again:

https://defence.pk/threads/average-...shi-credit-suisse.460337/page-11#post-8898077

https://defence.pk/threads/average-...shi-credit-suisse.460337/page-12#post-8898177

https://defence.pk/threads/average-...shi-credit-suisse.460337/page-14#post-8898253

The flaws become very apparent if you look at the full report and its results rather than tunnel visioning into two countries and your inherent butthurt :D

Median income and wealth figures in South Asia show that average Pakistanis are better off economically than their counterparts in India.

Yet Indians are expected to live longer, half their babies die in their 1st year compared to Pakistan and incidence of malnourishment and child stunting is much lower in India.

If you read up on how disjointed and haphazard income data is gathered in developing countries compared to health and literacy data, you would understand better why this strange discrepancy exists.
 
Oh look its this regurgitated topic again....

Already asked and answered (regarding the flaws). Let me just post my replies in that discussion again:

https://defence.pk/threads/average-...shi-credit-suisse.460337/page-11#post-8898077

https://defence.pk/threads/average-...shi-credit-suisse.460337/page-12#post-8898177

https://defence.pk/threads/average-...shi-credit-suisse.460337/page-14#post-8898253

The flaws become very apparent if you look at the full report and its results rather than tunnel visioning into two countries and your inherent butthurt :D

I have quoted data from at least 3 different reports issued by three different organizations: Credit Suisse, Oxfam and the Center for Global Development, research wing of the World Bank.

Which report do you have a problem with? Or do you dislike any report that reflects poorly on India?
 
I have quoted data from at least 3 different reports issued by three different organizations: Credit Suisse, Oxfam and World Bank.

Which report do you have a problem with? Or do you dislike any report that reflects poorly on India?

Oxfam one has already been tackled in another thread.

Credit suisse is the one I am mostly talking about here (read the links I posted as to some very interesting figures of Iran, Ukraine and Kazakhstan compared to India produced by them).

World bank povcal is also under major ongoing revamp right now. I wouldnt take much they release right now too seriously as their standards are in a major transition (from UMP to MMRP etc).
 
Oh look its this regurgitated topic again....

Yet Indians are expected to live longer, half their babies die in their 1st year compared to Pakistan and incidence of malnourishment and child stunting is much lower in India.

If you read up on how disjointed and haphazard income data is gathered in developing countries compared to health and literacy data, you would understand better why this strange discrepancy exists.

I guess your poor education prevents from understanding the difference between average and median

Average is skewed by a few high data points but the median reflects the mid-point which divides populations in two halves.
 
Last edited:
I guess your poor education prevents from understanding the difference between average and median

Average is skewed by a few high data points but the median reflects the mid-point which divides populations in two halves.

That is not the point I was making at all.

Be it median or mean (they are both averages along with mode), the data for many countries in the credit suisse report looks very dodgy to say the least, for the reasons I have already explained in the links posted above.

If people are interested, they can read them.

For example:


Ok so do you accept that Indians are considerably wealthier than Iranians? It makes a lot of sense to you?

Apparently the median wealth of Kazakhstan is 889 USD.....with GDP per adult of 22,000 USD.

Median wealth of Ukraine is similarly 166 USD :o: with nominal GDP per adult twice that of India.

====

Not my problem either if you know nothing about the World Bank povcal transition underway right now. They themselves have clearly stated that a complete overhaul of their methodology is underway to address the exact sort of things like Pakistan having a terrible infant mortality in contrast to its supposed low income poverty rate (both cannot hold, so obviously one is clearly flawed, and its most likely the latter given the methodologies and count rates employed)

Developing country's income, poverty and socioeconomic data are never a fun topic to analyse the veracity and credibility of (underlying data and methodology wise). It would be prudent to focus on how organisations like the World Bank are addressing this as time goes on, rather than regurgitating the same clearly flawed studies every few months for attempted cheap brownie point scoring.
 
Last edited:
I guess your poor education prevents from understanding the difference between average and median

Average is skewed by a few high data points but the median reflects the mid-point which divides populations in two halves.
Are you a fool? If the median is higher than your rich are richer and poor are poorer.
 
So the average Pakistani has more money to spend than his/her Indian counterpart? Am I right?
 
So the average Pakistani has more money to spend than his/her Indian counterpart? Am I right?

Like Hillary Clinton had a much higher chance than Trump of winning the elections according to the MSM polls :P

Its always best to dig at the data thoroughly than cherry pick numbered "results" and take them as complete fact.
 
Like Hillary Clinton had a much higher chance than Trump of winning the elections according to the MSM polls :P

Its always best to dig at the data thoroughly than cherry pick numbered "results" and take them as complete fact.
But the median income is quite the opposite of cherry picking, don't you think?
 
But the median income is quite the opposite of cherry picking, don't you think?

Nope it is definitely cherry picking.

Unless someone wants to accept that the "median" "wealth" per capita in resource rich Kazakhstan is 890 dollars...less than one quarter that of India (from the same credit suisse report)....with a GDP per capita 4 - 5 times higher than India. That would suggest an income distribution so skewed it would make the city of Moscow seem like an Israeli Kibbutz.

There are notable underlying problems in the methodology of that report (that credit suisse itself owns up to) that one must be careful of. For example accounting of debt spread evenly per capita rather than ramped appropriately when deciding to go for net wealth than gross wealth as your number of choice...its OK when comparing developed country to developed country somewhat...but developing countries wealth data can get affected seriously (a long topic to discuss). Thats why Kazakhstan, Iran, Ukraine (and others) get affected seriously in that study...and also say US compared to China even....no country is immune from the effects of that method, its all relative.

Same goes for povcal database in the world bank. They are in the midst of what one can call a massive accounting overhaul...so there are old and new standards in play across the board which makes that data have lower utility (for cross country comparison) for the time being. Again it requires one to dig deeper into all their articles, releases and analyses to see how they mention this clearly (and qualify their results appropriately)...rather than just taking sole numbers and expecting them to stand alone as the truth.

Right now the disparity between socioeconomic indicators of many countries like Pakistan in contrast to their poverty and income data should be the main talking point rather than simply saying a number from one side (of this equation that does not balance) is to be taken seriously and compared to another country's.

I challenge you for example to find one other country in the world with supposedly less than 10% of income poverty but has infant mortality more than 65 like Pakistan.

What is especially concerning is that many studies from within Pakistan itself are showing that literacy rate is dropping, child stunting is increasing etc from the mid 2000s to today. This has led to Pakistan's MPI (published by the same Oxfam the OP mentions) increasing (i.e relative multidimensional poverty increasing) as well. Given that within a country, the same data methodologies, sampling rates and analyses are used generally (compared to say other countries), this is extremely worrying indeed.

But I doubt you will see the OP posting about that.

@Roybot @Robinhood Pandey @Gibbs
 
Last edited:
It does make sense to use median to represent tendency in this case, because the data is not symmetric in distribution - meaning a lot more people have incomes leads than average than those with > average income.

But this comparison is quite invalid because it is using unstable data - besides what Nilgiris has pointed out, a question that must be answered is why is India data split urban and rural vs Pakistan where it is combined?
 
why is India data split urban and rural vs Pakistan where it is combined?

World Bank did it because of way the information (esp price level) is gathered in 3 populous countries: China, India and Indonesia.

The price level data is segregated in these 3 by the national statistic organisations of each essentially.

This introduces a new set of pros (theory based) and cons (practice based).....basically the more subsequent calculations (or high count rate, discretised complicated source data) you employ reduce the confidence levels and credibility of the results. Thats why median is not used in say the UN HDR reports...even though median would be in theory a nicer number to use for socioeconomic discussion compared to mean.

There is a detailed paper on that very subject dating from the late 90s I believe that I have to look up.
 
The Income Of The Average Indian Is Significantly Lower Than The Average Income Of India

http://swarajyamag.com/economy/the-...cantly-lower-than-the-average-income-of-india

"As Charles Wheelan writes in Naked Statistics: “The mean, or average, turns out to have some problems in that regard, namely, that it is prone to distortion by “outliers”, which are observations farther from the center.”

So basically, the Ambanis, Adanis, Birlas and Tatas, of the world, essentially India’s rich, push up the average income of India i.e. the per capita income. As Wheelan writes: “The average income...could be heavily skewed by the megarich.”

In this scenario, the average income does not give us a correct picture. Further, it is safe to say, that the income of the average Indian is lower than the average income of India.

At this point it is important to introduce another term i.e. the median. As Wheelan writes: “The median is the point that divides a distribution in half, meaning that half of the observation lie above the median and half lie below.”

Hence, the median income is the income of the average Indian. Given this, the median income is the right representation of the income of the average Indian. This is because the rich outliers (the Ambanis, the Adnanis, the Tatas and the Birlas) are taken into account. Data from World Bank shows that the top 10 percent of India’s population makes 30 percent of the total income. And this pushes up the per capita income."
 
World Bank did it because of way the information (esp price level) is gathered in 3 populous countries: China, India and Indonesia.

The price level data is segregated in these 3 by the national statistic organisations of each essentially.

This introduces a new set of pros (theory based) and cons (practice based).....basically the more subsequent calculations (or high count rate, discretised complicated source data) you employ reduce the confidence levels and credibility of the results. Thats why median is not used in say the UN HDR reports...even though median would be in theory a nicer number to use for socioeconomic discussion compared to mean.

There is a detailed paper on that very subject dating from the late 90s I believe that I have to look up.
According to Oxfam, 7.5% of the worlds poorest people live in the US! I call BS!

http://fusion.net/story/39185/oxfams-misleading-wealth-statistics/
 

Latest posts

Pakistan Affairs Latest Posts

Back
Top Bottom