What's new

American Economy News & Updates

Dollar Shakes Off Yuan Shock With Bullish Bets at Six-Month High
Kevin Buckland
August 16, 2015 — 5:10 PM PDTUpdated on August 16, 2015 — 9:19 PM PDT

The surge in bullish dollar bets to a six-month high has helped the currency as it shakes off declines following China’s shock yuan devaluation.

The dollar rose against all but one of its major peers Monday, rebounding from its worst week since June, after speculators added to net long positions for an eighth week through Aug. 11, the longest stretch in five years. The move by the People’s Bank of China weighed on the greenback amid speculation the Federal Reserve will delay its first interest-rate increase since 2006.

“With a September Fed hike priced around a 50 percent probability, any developments that suggest a change in timing are being acted upon,” said Sam Tuck, a senior currency strategist at ANZ Bank New Zealand Ltd. in Auckland. “We still expect the U.S. dollar to continue to appreciate, and are expecting a September hike.”


The Bloomberg Dollar Spot Index rose 0.1 percent to 1,209.98 at 1:17 p.m. in Tokyo, after falling 0.3 percent last week, the worst performance since the five days ended June 19. It touched an almost five-month high of 1,220.25 on Aug. 7.

The dollar added 0.2 percent to $1.1090 per euro, and strengthened to 124.39 yen from 124.31.

Australia’s dollar and New Zealand’s kiwi pared losses Monday after the PBOC set the yuan’s reference rate little changed from Friday. Australia’s currency was at 73.76 U.S. cents from 73.79, while the kiwi fetched 65.38 cents from 65.47.

National Australia Bank Ltd. cut forecasts for the Aussie for the end of September to 72 U.S. cents from 74 cents, and predicted a bottom of 68 cents at the end of March.

Odds Cut
Futures traders reduced the odds that the Fed will raise rates in September to as low as 40 percent last week from as high as 54 percent on Aug. 7, based on the assumption that the effective fed funds rate will average 0.375 percent after the first increase. As of Friday, the probability was 48 percent.

Relative to economist estimates, the U.S. is showing its best performance since February, according to a Bloomberg gauge.

“September remains our base case for the first rate hike,” RBC Capital Markets LLC analysts, including New York-based chief U.S. economist Tom Porcelli, wrote in a client note dated Aug. 17. “Purely from a fundamental U.S. economic perspective, the events in China are unlikely to impact the U.S. economic data in a significant adverse way. But it should not be lost on anyone that the calculus for the Fed is not that simple.”

Dollar Shakes Off Yuan Shock With Bullish Bets at Six-Month High - Bloomberg Business
 
About that stock market correction:

...

This is the most important chart about the stock market crash

This is the most important chart about the stock market crash

It's easy to freak out over the US stock market crash when you see a CNN front page like this:

cnn.png


And it is true that global stock markets have had a rough morning. The Dow fell 1,000 points in its first four minutes of trading Monday morning (although it has recovered a good deal since). Still, when you put that drop into context — as economist Justin Wolfers does — you realize that the drop pales in comparison to all the gains the market has made over the past decade.

CNLXnSkWgAAZQMK.png


So, as the CNN homepage warns (in tiny font that you probably missed the first time): Don't panic. Definitely don't sell off your stocks. Perhaps visit this website. And remember that markets go up and down, and that in the decade-long scheme of things the market still has seen relatively robust growth.

...

My, my, well that sure does make it seem a lot less bad.
Agreed. Unless you have absolutely no choice and will have to declare bankruptcy or you are not confident in the solvency of your investments, it is always a bad idea to sell during a downturn.:P
 
The U.S. Economy Is Just Starting to Tap Into a Big Source of Dry Powder
The U.S. Economy Is Just Starting to Tap Into a Big Source of Dry Powder - Bloomberg Business

There's a big reason to believe that the U.S. economy will be able to withstand the start of the Fed tightening cycle: There's still plenty of pent up activity in the housing sector. And it's hard to see the U.S. economy running out of steam with this much upside left in residential investment, according to some economists and analysts.

Going back to the 1940s, the U.S. central bank has never embarked upon a tightening phase with housing having so much room to run to the upside.

488x-1.jpg

Macquarie, Bloomberg
This chart shows residential investment's share of nominal gross domestic product, with the start of the previous six rate hike cycles denoted with a circle.


The severity of the housing bust prompted activity in this sector to stay at depressed levels, even with the Great Recession getting farther away in the rear view mirror.

Residential investment accounts for 3.34 percent of nominal gross domestic product, as of Q2 2015, well below its long-run average of 4.56 percent, as Macquarie analyst David Doyle has observed. The Fed has not initiated a series of rate hikes at a time when residential investment's share of gross domestic product is more than one standard deviation below its long-run average since at least 1970.

"Business cycle expansions are likely when residential investment is low as a share of GDP," wrote Doyle. "Recessions typically only transpire when residential investment becomes elevated as a share of GDP."

While there is plenty of upside for construction activity, the availability of workers to carry this out is more suspect.


Neil Dutta, head of U.S. economics at Renaissance Macro Research in New York, noted that the relative strength of the labor and housing market makes for quite an abnormal dynamic.

"What is interesting about this is that the housing market is accelerating at a time when the labor market is near full employment," he said.

He suggested that any shortage of construction workers could be remedied by displaced mining employees and higher wages to attract additional labor.

The unemployment rate, which dipped to 5.1 percent in August, has rapidly converged upon the Federal Reserve's estimates for the non-accelerating inflation rate of unemployment, which is a range of 5 percent to 5.2 percent. That is, monetary policymakers think that 5 percent is the lowest the unemployment rate can get before inflationary pressures start to arise.

Labor slack has been eliminated at a rapid pace, though broader measures of the health of the jobs market suggest work remains to be done.

488x-1.jpg

Bloomberg
On a recent interview on BloombergTV, New River Investment portfolio manager Conor Sen indicated that the U.S. single-family housing market would enjoy a strong secular tailwind over the next 10 to 15 years as millennials formed households and shifted from renting to owning homes.

Sen separately observed that single-family housing starts, as a share of the prime age population (25 to 54 years old), remain at very subdued levels. If single-family starts normalize to 1.25 million, more than 250,000 workers would be needed to erect them, assuming that the ratio between starts and residential construction jobs reverts to what it has averaged since the start of 1985.

Dutta concurred with the demographic support for construction activity, pointing out that children born in the 1980s, when the birth rate was climbing, will make up the next batch of first-time homebuyers. He also noted that cyclical forces, such as easing lending standards and rising homebuilder confidence, buoy the outlook for the sector.

"Bad things do not happen to America when housing is moving up and to the right while Americans are finding jobs," said Dutta.
 
US final Q2 gross domestic product 3.9% vs 3.7% expected

The U.S. economy expanded more than previously estimated in the second quarter on stronger consumer spending and construction, the second upward revision in a row.

The Commerce Department said on Friday gross domestic productrose at a 3.9 percent annual pace in the April-June quarter, up from the 3.7 percent pace reported last month.

The rise, which beat expectations in a Reuters poll for the third reading of Q2 economic growth to be unchanged at 3.7 percent, was driven by growth in consumer spending, mainly on services like health care and transport.

Consumer spending, which accounts for more than two thirds of U.S. economic activity, was revised up to a 3.6 percent growth pace from the 3.1 percent rate reported in August, helped by cheap gasoline prices and relatively higher house prices boosting household wealth.

Revised construction spending data helped to push up the headline figure, with non-residential fixed investment expanding 4.1 percent in the quarter.

The revisions to second-quarter growth also reflected a smaller accumulation of inventories than earlier estimated, with inventories contributing just 0.02 percentage point to growth rather than adding 0.22 percentage point.

After-tax corporate profits were also stronger in the second quarter than previously thought. Profits after tax with inventory valuation and capital consumption adjustments showed a 2.6 percent rebound from a slump in late 2014 and early 2015, instead of the 1.3 percent increase reported last month.

The data supports the case that the U.S. economy may be gaining enough strength to withstand an increase in benchmark interest rates from record low levels.

The U.S. Federal Reserve last week held off on hiking rates, but Fed Chair Janet Yellen kept the door open to an increase this year in a speech on Thursday night, as long as inflation remains stable and growth is strong enough to boost employment.
 
Trade deal to lift the economy, consumers

The sweeping trade deal between the U.S. and 11Pacific Rim nations announced Monday, should boost the U.S. economy and lower consumer prices on some imports, experts say.

The Trans-Pacific partnership, which still faces a long, tough battle in Congress, covers countries that make up 40% of the global economy.

"This agreement is unlikely to be a game changer for the U.S. economy in the short run," says Eswar Pradad, a professor of trade policy at Cornell University. "But it could have significant net positive effects in the long run."

That's because the U.S. currently imposes far fewer trade barriers, such as tariffs, than the other participating nations, providing the nation a bigger upside as those taxes are lowered or eliminated, Prasad says.

For example, the agreement does away with tariffs as high as 59% on U.S. machinery, up to 70% on automotive products and up to 40% on agricultural products such as poultry and fruit, according to the White House.

The deal "will strengthen America's standing in the world and help our industry maintain leadership in the global market," says John Neuffer, head of theSemiconductor Industry Association.

And it would force the participating countries to comply with the same labor and environmental laws that bind the U.S., Prasad says, erasing a key cost advantage those nations currently enjoy. "It certainly levels the playing field."

The agreement also would lower regulatory barriers for U. S. services firms, such as financial and express delivery companies, says C. Fred Bergsten, a senior fellow at thePeterson Institute for International Economics. That's a huge market in which the U.S. has a large trade surplus, in contrast to its yawning deficit in traded goods.

Consumers should gain as well. Reduced tariffs on imports should cut prices by 5% to 10% for some electronics, clothing and auto-parts, Bergsten says. And an agreement to reduce the 12 years of U.S. patent protection for so-called biologic drugs will make cheaper generics available to consumers sooner.

On the other side, the pact would cut or eliminate U.S. tariffs on products such as steel, sugar and textiles for the Pacific Rim countries, which include Japan, Chile, Vietnam,Malaysia and New Zealand, Bergsten says. That would increase competition for domestic companies and could encourage more offshoring of U.S. jobs.

And some U.S. automakers worry that Japan will be motivated to manipulate its currency to lower the costs of Japanese auto imports.

But the U.S. stands to gain far more than it will lose, he says. In a decade, he estimates, the deal will increase the nation's annual exports by $100 billion to $125 billion and its gross domestic product by about $75 billion, adding about half a percentage point to economic growth.

Peterson economists estimate it would add about 650,000 jobs in export-related industries while cutting a similar number of positions in domestic industries that would face more competition from imports. Bergsten says it will result in a net addition of jobs, though he could not be more specific.
 
Strong Growth in Jobs May Encourage Fed to Raise Rates

By NELSON D. SCHWARTZ
NOV. 6, 2015

The American economy added 271,000 jobs in October, the government reported Friday, a very strong showing that makes an interest-rate increase by the Federal Reserve much more likely when policy makers meet next month.

The unemployment rate dipped to 5 percent, from 5.1 percent in September. Average hourly earnings also bounced back, rising 0.4 percent in October after showing no increase in September; that lifted the gain to 2.5 percent over the last 12 months, the healthiest since 2009.

The combination of the surge in job creation, rising wages and the falling unemployment rate all increase the pressure on the Fed to finally move on rates after months of debate and uncertainty amid economic turmoil overseas. It also largely puts to rest any lingering fears of a new recession and suggests that the economy is likely to continue to improve as the nation heads into an election year.

“At last, a payroll report which makes sense,” said Ian Shepherdson, chief economist at Pantheon Macroeconomics. After two relatively weak reports that were hard to explain, given other, healthier economic data, he said, “this is consistent with all the advance indicators.”

“Barring a disaster in November,” Mr. Shepherdson said, “rates are going to rise in December.”

At 5 percent, the unemployment rate is very close to what would normally be considered the threshold for full employment by the Fed and many private economists.

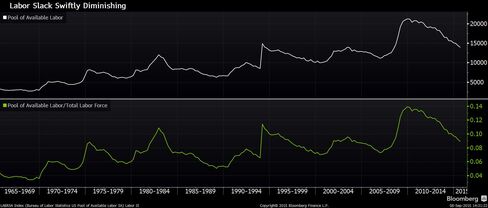
The slack that built up in the labor market after the recession, however, has altered traditional calculations of how far unemployment can fall before the job market tightens and the risk of inflation rises.

The proportion of Americans who are in the labor force, which fell to a 38-year low of 62.4 percent for September, was unchanged last month.

This week, Janet L. Yellen, the chairwoman of the Fed, told a panel on Capitol Hill that an increase in December was a “live possibility” if the economy continued to perform well.

Ms. Yellen left herself and the rest of the Open Market Committee of the Fed plenty of wiggle room, emphasizing that no decision had been made on whether to raise rates for the first time in nearly a decade. They will have an additional jobs report for November in hand by the time they gather for their last meeting of the year, on Dec. 15 and 16.

But the surprising strength of the economy in October puts the Fed on track to finally bring to an end an eight-year period of near-zero interest rates. Although the initial interest rate increase would be small, most likely a quarter of a percentage point, any increase would represent a new era for investors and borrowers here and abroad.

The Labor Department’s broadest measure of unemployment, which includes workers forced to take part-time jobs because full-time work is unavailable, fell to 9.8 percent in October from 10 percent in September. A year ago, it was over 11 percent.

With the strong October data, economists are already beginning to look beyond the first move to the question of how fast the Fed will have to make subsequent rate increases if the labor market continues to tighten.

“Regardless of the exact timing of the first rate hike, we still believe that the big story next year will be an unexpectedly strong pickup in wage growth and price inflation,” said Paul Ashworth, chief United States economist at Capital Economics. This trend, he said, “will force the Fed into a much more aggressive policy-tightening cycle than the Fed’s projections currently suggest.”

Before the report on Friday, economists had been anticipating a payroll increase of about 180,000 jobs, with the unemployment rate remaining unchanged from September’s level. The Labor Department revised upward the total number of jobs created in August and September by 12,000.

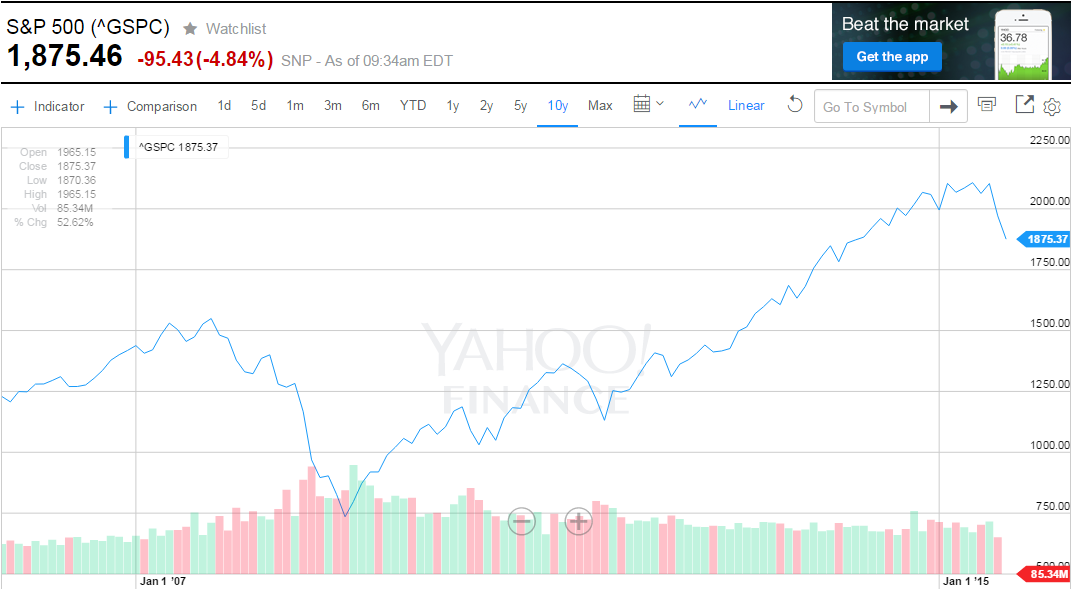
The picture of labor market strength evident in the data sent bond yields surging in the minutes after the release of the report, as traders rapidly adjusted for the likelihood of a December move.

Although a small proportion of total employment, manufacturing has been one source of weakness, losing more than 25,000 jobs over the summer amid softening demand from Asia and other export markets. The mining and logging sector has also been shedding jobs, cutting more than 100,000 positions this year as prices of oil, iron and other commodities have plunged.

Still, many other areas of the economy — like professional and business services, health care, and leisure and hospitality — have been very strong, with employment in each of those three sectors increasing by more than 30,000 jobs in September.

The pattern persisted in October: Factory jobs were unchanged, while mining and logging lost 4,000 positions. Professional and business services, meanwhile, recorded a huge 78,000 increase in jobs. Health care hiring was also robust, with a 56,700 increase.

White-collar employers like Ernst & Young, the accounting and consulting giant, have been on something of a hiring binge. Over the course of the company’s 2016 fiscal year, which began in July, Ernst & Young plans to hire just over 17,000 new employees in the United States, with roughly 10,000 joining straight out of college.

In July, August, and September, the firm added 2,500 more experienced accountants and consultants, said Dan Black, director of recruiting for the Americas.

“Whether it’s dealing with taxes, regulations or technology, our clients want help,” Mr. Black said.

Nearly all the positions, whether entry-level or for more experienced workers, require at least a bachelor’s degree, underscoring how crucial credentials and specialized skills have become in today’s job market.

Starting salaries for holders of newly minted degrees in fields like accounting, finance and computer sciences frequently range above $50,000 or $60,000, Mr. Black said. Veteran workers in hot fields like cloud computing and cybersecurity can command much more.

“For experienced talent, it’s a dogfight,” he said. “In 2008 and 2009, as companies cut back, we had our pick of the litter. Now it’s much more competitive.”
 
U.S. adds 2.65 million jobs in 2015 for 2nd best year since 1999

by Patrick Gillespie

January 8, 2016

In the face of global fears, the U.S. economy is still gaining speed.

American employers added 292,000 jobs in December. Economists surveyed by CNNMoney predicted 211,000 jobs would be added.

For all of 2015, the economy added 2.65 million jobs, the second best year of jobs gains since 1999.

The unemployment rate stayed at 5% for the third straight month. That's near what most economists consider "full employment." Unemployment is down by half from its peak of 10% in 2009.

Americans saw their paychecks go up too. Wages grew 2.5% in December from a year ago, matching the annual gains in October, which were the best in six years. However, compared to November, wages fell a penny.

160108083501-unemployment-rate-since-2009-780x439.png


Wages have been one of the last indicators to turn the corner in the U.S. recovery and they're finally gaining momentum. Growth in November was solid too.

"There are a lot of indicators that show the economy continues to move in the right direction," U.S. Secretary of Labor Tom Perez told CNNMoney.

Most business areas added jobs, but the big winners in December were construction, health care and business services. Those three industries accounted for half of December's job gains.

Energy jobs, however, continued to fall as the collapse in oil prices kept up pressure on the industry. The industry cut back 8,000 jobs in December for a total of 130,000 jobs lost for all of 2015.

December's job gains are a reassuring sign that the U.S. economy has shown resiliency in the face of a slowdown in the global economy. Just this week, stock markets around the world panicked on fears that the global slowdown -- led China and falling oil prices -- is worsening.

Despite those headwinds -- which appeared to hold back job growth this summer -- America's economy keeps picking up momentum.

"After slowing in late summer, job growth has reaccelerated," says Sal Guatieri, senior economist at BMO Capital Markets.

The Federal Reserve sees the economy continuing to grow in 2016. In December, it gave its vote of confidence by raising its key interest rate for the first time in nearly a decade. The decision was mainly driven by the job market's progress.

America's economy made major progress on a number of measures last year. More people found full time jobs. The number of people who want a full-time job but can only find a part-time job -- called involuntary part-time workers -- fell by 760,000 workers over the year to 6 million in December. It's down from a peak of 9.2 million workers in 2010.

The number of people unemployed for six months or longer fell by over 600,000 last year too. High levels of long-term unemployed workers and part-time workers in recent years are partially why wage growth has been so sluggish.

Another bright spot was that black workers had an impressive month and year of jobs gains after suffering the most during the recession and recovery. The black unemployment rate fell to 8.3% in December from 9.4% in November. That's still much higher than other demographics but a year ago the black unemployment rate was at 10.4%.

All those signs of progress are reassuring at a time when there's renewed fears about the global economy. When jobs are added, people have more money in the wallets to spend, and American consumers are the major engine behind U.S. economic growth.

This year's gains "should keep the U.S. expansion on track despite downside risks from abroad," says Jesse Hurwtiz, senior U.S. economist at Barclays. On December: "Overall, it was a very strong report."
 
Freight Rail: A (surprisingly) high-tech industry

By Edward R. Hamberger, President and CEO of the Association of American Railroads
02/02/16

When you think of sophisticated ultrasonic detection analysis, Big Data or drones, America’s freight railroads might not spring to mind. But they should. These technologies are just a few of the innovative tools freight railroads are deploying to make America’s freight railroad system safer than ever.


The freight rail industry knows from experience how innovation cultivates a safer system. Rail accidents and injuries over the past several decades have plummeted as a result of railroads’ sustained and hefty annual private investment in new rail infrastructure, safety research, training and technology.

All told, the industry has spent approximately $600 billion upgrading, modernizing and maintaining its infrastructure and equipment since 1980. And through 2014, the train accident rate fell 79 percent, and the rail employee injury rate fell 83 percent. Improvements and enhancements to the overall network create a safer, more efficient railroad, with the benefits reaching customers who rely on freight rail to move their businesses forward.

download (15).jpg


Over the last five years, freight railroads have spent about $25 billion annually on the nation’s freight rail network, and these investments will continue so that the network’s infrastructure and technology are second to none. A few examples illustrate how one of America’s most storied modes of transportation is writing new chapters every day:

Ultrasound for Rails: Railroads have long performed safety inspections on track using ultrasound technology similar to what doctors use to see inside the body and diagnose ailments in patients. To speed up the inspection of rails and achieve more precise results, railroads are improving this ultrasound technology with “phased array” detectors. Soon, rail inspectors will be able to look inside a piece of steel from hundreds of angles in a matter of minutes and produce images with a level of microscopic detail that was never before possible. If an otherwise invisible crack is detected, the repair can be proactively scheduled before a problem occurs. Read more.

Tapping Big Data: Anticipating problems before they arise is critically important to a safe and efficient rail network and railroads are using Big Data to do just that. Through the Asset Health Strategic Initiative (AHSI), railroads are collaborating in an unprecedented way to identify equipment problems before they occur. Managed by Railinc—a trusted third party in the freight rail industry—AHSI allows railroads and railcar owners to share rail equipment performance information gathered as equipment travels across the entirety of the 140,000-mile rail network, not just on their own individual networks, thereby providing a more holistic view of equipment performance and quicker identification of problems. The ultimate goal, of course, is improving railroad safety and efficiency, and this nascent program is already helping to achieve that, preventing an estimated 1,000-plus service interruptions in 2015. And this is just the beginning; as railroads gather and analyze more and different kinds of data, they will be able to predict and prevent equipment failure in ways never before possible. Read more.

Safety Drones: Unmanned aerial technology, also known as drones, has the potential to help railroads further monitor the network and its surroundings and keep it safe in new ways. Several Class I freight railroads are exploring the use of drones, including Burlington Northern Sante Fe Railway (BNSF), which is studying the long-range use of drones to monitor hundreds of miles of rail at a time. The company’s effort is part of an innovative public-private partnership with the Federal Aviation Administration designed to help various industries research the safe use of drones in crowded cities or wide-open spaces. If successful, drones could give railroads a bird’s-eye view to better inspect their lines—particularly when employee safety is at risk. For example, when record flooding hit Texas and Oklahoma in 2015, the waters washed away homes, businesses and infrastructure—including freight railroad tracks. During this time, BNSF flew drones mounted with high-definition video cameras over areas of the flood zone to inspect parts of the rail network that were difficult—or dangerous—to access from the ground. With information about the flood’s effects in hand, BNSF deployed employees where they were needed most to quickly return the rail line to safe operation. Read more.

Of course, technology evolves swiftly these days. This year drones, next year—who knows? That’s why the freight rail industry continues to innovate and invest in technology. Doing so ensures that the United States has the safest and most reliable rail network in the world—one that is always positioned to bring value to freight rail customers while keeping America’s economy moving.
 
How Does the U.S. Economy Compare to the World’s?

Nicholas Vardy| Feb 19, 2016

In the 1970s, Americans grew up with two myths.

The first myth was that the Soviet Union would dominate the U.S. militarily. The second myth was that the Japanese would dominate the U.S. economically.


With the Soviet Union erased from the present-day map of the world and the Japanese stock market falling to below levels it last traded at in May of 1986, both fears seem almost quaint today.

Yet, until a year ago, the conventional wisdom that Brazil, Russia, India and China — the BRIC countries — were set to dominate the United States was just as compelling.

The U.S. Economic Map: Size Matters

With the U.S. political scene dominated by partisan vitriol, soaring taxes and health care costs and small businesses being crushed by suffocating regulations, it’s worth reminding ourselves where the U.S. economy stands in comparison to the rest of the world today.

Despite the high economic growth rates of developing nations, the United States is by far the world’s wealthiest nation, as measured by gross domestic product (GDP) — the broadest measure of economic wealth.

The rest of the world doesn’t even come close.

This year, U.S. GDP should hit $18 trillion.


That means that the U.S. economy is about as large as the next three-largest economies in the world — China, Japan and Germany — combined.

Since 2003, Earl Fry, a professor of Political Science at Brigham Young University, has been producing U.S. maps on a regular basis where the states are renamed with countries that have similar GDP levels.

The 2014 version of the map — puts the size of the United States’ global rivals in perspective.

usa20143.jpg


On the map, the name of each state is replaced by a country whose GDP equals approximately that state’s gross state product (GSP).

A quick glance at the map leads to some fascinating — and unexpected — comparisons.

If it were a stand-alone country, California would be the eighth-largest economy in the world and approximately the size of Brazil’s economy. Texas’ economy is half the size of California’s and its GSP is comparable to that of Canada. Florida’s GSP is approximately the size of the Netherlands’ economy. Illinois’ economy is approximately the size of Saudi Arabia’s. Pennsylvania’s economy is roughly the size of Switzerland’s. New York’s GSP is the size of Spain’s economy, and Georgia’s economy is the size of Norway’s. Bill Clinton’s home state of Arkansas, one of the poorest states in the United States, is approximately the size of Ireland’s rebounding economy.

The U.S. Economic Map: Three Caveats

Looking at the United States versus the world this way comes with several important caveats.

First, the map is based on nominal GDP — how much wealth is generated in dollar terms — and not how many goods and services those dollars buy.

Economists and the media often prefer to use “purchasing power parity” (PPP) when comparing the size of global economies. Think of PPP as similar to a “cost of living adjustment” on a country level. Within the United States, $50,000 in Kansas buys you a lot more than it does in Manhattan. That’s why on a purchasing power basis, China’s economy has already surpassed the United States, while in absolute terms it’s only about 60% of the size of the United States.

Second, the map does not adjust for population. This has huge implications for what economic wealth means to citizens. California and Texas have a combined population of 66 million, while China’s population is 1.36 billion. Let’s say China does become the largest economy in the world in 20 years. Yet, because of its large population, even if it continues growing at its current pace (a huge assumption), by 2050 it will only be as wealthy as former Communist bloc countries in Eastern Europe are today.

Finally, a look at the map frozen in time, while reassuring, also hides some dynamic changes. When I first looked at this map in 2007, Germany and China — at the time #3 and #4 on the list of the world’s largest economies — were both smaller than the economies of Texas and California combined.

Today, the comparison with Germany still stands. But China is now more than twice as big as the two largest U.S. states together. In 2007, India’s $800 billion economy was on par with Florida. Today, India’s economy is 2.4 times larger than the Sunshine State.

China and India have clearly made great leaps forward in both absolute and relative terms.

The U.S. Economic Map: The Past… and the Future

In 1790, the United States was a new, tiny nation of 4 million, about the size of Ireland today. Europe’s population was 180 million, while India’s was 190 million and China’s was 320 million. Only seven cities had a population of 5,000 or more; just 12 had a population greater than 2,500. The United States had an agricultural economy with practically no factories.

Fast forward to 1885, the United States was the world’s #1 manufacturer, producing almost 30% of the world’s manufactured goods to outpace both the British Empire and Germany. Today’s leading cutting-edge global industries — whether taking root in Silicon Valley, in Hollywood or on Wall Street — are still products of the U.S. economic experiment.

Despite its challenges, in 2014, the United States produced 22.5% of the world’s GDP with only about 4.6% of the world’s population. Although the U.S. economy was not as dominant as it was directly after World War II, the rest of the world (outside of China and India) has hardly fared better since the 1980s. The Japanese economy has not matched U.S. growth rates for the last two decades. Europe barely ekes out an economic growth rate of 1%. And how sustainable and real the Chinese economic expansion of the past two decades is remains to be seen.

The world has been counting out the United States’ contribution as far back as I can remember.

That U.S. economic map though provides a vivid reminder of just where the United States stands in the bigger picture.
 
http://www.bbc.com/news/business-37934203
_92383963_nysetradersreuters.jpg
Image copyrightREUTERS

US financial markets appear be embracing Donald Trump's election with the Dow Jones closing at an all-time high and the S&P500 also edging up.

Hopes that Mr Trump will introduce a pro-business agenda have blunted earlier concerns about his win.

Stock traders sought out firms standing to gain from his presidency, with American banks among the winners.

But shares in some of the biggest tech firms took a hit, pulling the Nasdaq index into negative territory.

The Dow Jones ended the day 1.17% higher at 18,807.88 points, while the S&P 500 index rose 0.2% to 2,167.48 points.

Investors have shifted to a focus on Mr Trump's priorities, including tax cuts, an increase in defence and infrastructure spending, and bank deregulation.

Bank shares, buoyed by hopes that Mr Trump will relax financial regulation, were among the biggest Wall Street gainers.

But the Nasdaq index, which has a large number of technology stocks, finished down 0.81% at 5,208.80. Apple, Amazon, Google and Facebook shares all took a hit.

Analysts said tech companies would be hurt by any trade barriers brought in by Mr Trump, and would not benefit as much from his plans for lower taxes and higher infrastructure spending.

"Tech has the most important export exposure of any sector, so there are some fears of rising trade barriers that would hit tech pretty meaningfully," said Mike Bailey, director of research at FBB Capital Partners.

'Markets volatility'
In Europe, the FTSE 100 closed lower after a rally which took it near the 7,000 level ran out of steam. The UK index finished down 1.2% at 6,823 points.

Germany's Dax and France's Cac indexes, which had earlier been more than 1% ahead, each closed about 0.2% lower.

Mark Dampier, analyst at Hargreaves Lansdown, told the BBC that some investors were taking profits. He forecast continued volatility as the markets digested what a Donald Trump presidency would mean.

But Lee Wild, head of equity strategy at stockbroker Interactive Investor, said: "Perception now is that the controversial multi-billionaire TV presenter and property mogul could be good for business; and talk of tax cuts and heavy spending on infrastructure would certainly be good for growth."

CMC Markets strategist Michael McCarthy said it appeared a consensus was building that much of Mr Trump's rhetoric during the campaign "was a sales pitch rather than a commitment to act".

_92349095_franfkurttradergetty.jpg
Image copyrightGETTY IMAGES
Earlier, Asia's markets had continued the stock market rally that gathered pace on Wednesday. Japan's Nikkei index closed up 6.7%, more than recovering losses from the previous session. Hong Kong's Hang Seng closed 1.9% higher.

On the currency markets, sterling rose 0.8% against the dollar to $1.2514, and was up 1.2% against the euro at €1.1507.

Traders had expected Hillary Clinton to beat Mr Trump to become the next US president. His victory initially sent money flowing into stocks that were deemed to be safer, as well as traditional haven assets such as gold and currencies including the yen.

"Investors were risk averse yesterday, then after seeing that Americans were optimistic and chasing the market higher, they wasted no time reversing their positions," said Takuya Takahashi, a strategist at Daiwa Securities in Tokyo.

And Nariman Behravesh, chief economist at IHS Markit, said that "after the initial shock, investors seem to feel that a Trump administration could be good news for US businesses, with lower taxes and a reduced regulatory burden".

He added that while Mr Trump had set out several broad economic policies, including corporate tax breaks and the renegotiating or scrapping of trade deals, there was no certainty these would go ahead.

"As in the past, it is unclear how much of the campaign bluster will translate into actual policy initiatives."
 
if you didn't buy the dead cat bounce I feel bad for you son.

i am sure a lot of billionaires made a lot of money.
 
http://www.rttnews.com/2714865/u-s-dollar-rallies-on-trump-stimulus-hopes.aspx?type=cm

The U.S. dollar was higher against its key counterparts in the European session on Thursday, as investors cheered the President-elect Donald Trump's fiscal stimulus plan, promising tax cuts and raising spending on defense and infrastructure to spur American economy.

Market participants are speculating that Trump's prospect of tax reforms and higher government spending would boost growth and inflation.

Global stocks rallied on hopes that Trump push for infrastructure spending and other initiatives would be a boon for businesses.

The U.S. treasury yields rallied, with the benchmark yield on 10-year note rising 2.10 percent, while that 2-year equivalent was up by 0.93 percent. Yields move inversely to bond prices.

The Fed is expected to raise rates at next month's meeting after holding it steady since December 2015.

S&P Global Ratings retained sovereign ratings of the U.S., after Donald Trump won the U.S. presidential election.

The rating was affirmed at 'AA+' with stable outlook. The ratings reflect the expected smooth transition of power, a hallmark of U.S. democracy, and the strength of its institutions.

The greenback was trading mixed in the Asian session. While the greenback rose against the yen, it held steady against the rest of major counterparts.

The greenback appreciated to 106.94 against the Japanese yen, a level not seen since July 21. The greenback is likely to challenge resistance around the 108.00 mark.

Data from the Bank of Japan showed that Japan's M2 money stock rose 3.7 percent on year in October, coming in at 945.1 trillion yen.

That exceeded forecasts for 3.6 percent following the downwardly revised 3.5 percent increase in September.

The greenback spiked up to a 9-day high of 0.9890 against the Swiss franc, up from Wednesday's closing value of 0.9844. Continuation of the greenback's uptrend may see it challenging resistance near the 1.00 region.

The greenback climbed to near a 2-week high of 1.0870 against the euro from yesterday's closing value of 1.0909. Further gains may take the greenback to a resistance around the 1.07 zone.

The greenback edged up to 1.2378 against the pound, from an early low of 1.2456, and held steady thereafter. If the greenback extends rally, 1.22 is possibly seen as its next resistance level.

The latest survey from the Royal Institution of Chartered Surveyors showed that the U.K. house price balance jumped 23.0 percent in October.

That beat forecasts for an increase of 18.0 percent, which would have been unchanged from the previous month following an upward revision from 17.0 percent.

Extending early rally, the greenback climbed to an 8-day high of 0.7204 against the NZ dollar. This is up by 1.4 percent from a low of 0.7307 hit at 3:30 am ET. The greenback is seen finding resistance around the 0.70 region.

The greenback advanced to 0.7648 against the aussie and 1.3498 against the loonie, from its previous lows of 0.7742 and 1.3387, respectively. The greenback is poised to challenge resistance around 0.75 against the aussie and 1.36 against the loonie.

Looking ahead, Canada housing price index for September and U.S. weekly jobless claims for the week ended November 5 are due to be released in the New York session.

At 9:15 am ET, Federal Reserve Bank of St. Louis President James Bullard is expected to speak about the US economic outlook at the Commerce Bank conference in St. Louis.

At 9:50 am ET, European Central Bank Vice President Vitor Constancio at the annual Swedish Banker's Association meeting in Stockholm.
 

Back
Top Bottom